10-Q: Quarterly report [Sections 13 or 15(d)]
Published on July 28, 2025
UNITED STATES
SECURITIES AND EXCHANGE COMMISSION
Washington, DC 20549
FORM 10-Q
| Quarterly Report Pursuant to Section 13 or 15(d) of the Securities Exchange Act of 1934 | |||||
For the quarterly period ended June 30, 2025
or
| Transition Report Pursuant to Section 13 or 15(d) of the Securities Exchange Act of 1934 | |||||
Commission File Number: 001-09819
(Exact name of registrant as specified in its charter)
| (State or other jurisdiction of incorporation or organization) | (I.R.S. Employer Identification No.) | |||||||||||||||||||
| (Address of principal executive offices) | (Zip Code) | |||||||||||||||||||
| (Registrant’s telephone number, including area code) | ||||||||||||||||||||
| Securities registered pursuant to Section 12(b) of the Act: | ||||||||||||||
| Title of each class | Trading Symbol(s) | Name of each exchange on which registered | ||||||||||||
| Indicate by check mark whether the registrant (1) has filed all reports required to be filed by Section 13 or 15(d) of the Securities Exchange Act of 1934 during the preceding 12 months (or for such shorter period that the registrant was required to file such reports), and (2) has been subject to such filing requirements for the past 90 days. | ||||||||||||||
| ☒ | No |
☐ | ||||||||||||
| Indicate by check mark whether the registrant has submitted electronically every Interactive Data File required to be submitted pursuant to Rule 405 of Regulation S-T (§232.405 of this chapter) during the preceding 12 months (or for such shorter period that the registrant was required to submit such files). | ||||||||||||||
| ☒ | No |
☐ | ||||||||||||
| Indicate by check mark whether the registrant is a large accelerated filer, an accelerated filer, a non-accelerated filer, a smaller reporting company, or an emerging growth company. See the definitions of “large accelerated filer,” “accelerated filer,” “smaller reporting company,” and "emerging growth company" in Rule 12b-2 of the Exchange Act. | ||||||||||||||
| ☒ | Accelerated filer | ☐ | ||||||||||||
| Non-accelerated filer | ☐ | Smaller reporting company | ||||||||||||
| Emerging growth company | ||||||||||||||
| If an emerging growth company, indicate by check mark if the registrant has elected not to use the extended transition period for complying with any new or revised financial accounting standards provided pursuant to Section 13(a) of the Exchange Act. ☐ | ||||||||||||||
| Indicate by check mark whether the registrant is a shell company (as defined in Rule 12b-2 of the Exchange Act). | ||||||||||||||
Yes |
No |
☒ | ||||||||||||
On July 23, 2025, the registrant had | ||||||||||||||
DYNEX CAPITAL, INC.
FORM 10-Q
INDEX
| Page | |||||||||||
PART I. FINANCIAL INFORMATION |
|||||||||||
| Item 1. | Financial Statements | ||||||||||
Consolidated Balance Sheets as of June 30, 2025 (unaudited) and December 31, 2024 |
|||||||||||
Consolidated Statements of Comprehensive Income (Loss) for the three and six months ended June 30, 2025 (unaudited) and June 30, 2024 (unaudited) |
|||||||||||
|
Consolidated Statements of Shareholders' Equity for the three and six months ended
June 30, 2025 (unaudited) and June 30, 2024 (unaudited)
|
|||||||||||
|
Consolidated Statements of Cash Flows for the six months ended
June 30, 2025 (unaudited) and June 30, 2024 (unaudited)
|
|||||||||||
Notes to the Consolidated Financial Statements (unaudited) |
|||||||||||
| Item 2. | Management’s Discussion and Analysis of Financial Condition and Results of Operations | ||||||||||
| Item 3. | Quantitative and Qualitative Disclosures About Market Risk | ||||||||||
| Item 4. | Controls and Procedures | ||||||||||
| PART II. OTHER INFORMATION | |||||||||||
| Item 1. | Legal Proceedings | ||||||||||
| Item 1A. | Risk Factors | ||||||||||
| Item 2. | Unregistered Sale of Equity and Use of Proceeds | ||||||||||
| Item 3. | Defaults Upon Senior Securities | ||||||||||
| Item 4. | Mine Safety Disclosures | ||||||||||
| Item 5. | Other Information | ||||||||||
| Item 6. | Exhibits | ||||||||||
| SIGNATURES | |||||||||||
i
DYNEX CAPITAL, INC.
CONSOLIDATED BALANCE SHEETS
($s in thousands except per share data)
| June 30, 2025 | December 31, 2024 | ||||||||||
| ASSETS | (unaudited) | ||||||||||
| Cash and cash equivalents | $ | $ | |||||||||
| Cash collateral posted to counterparties | |||||||||||
Mortgage-backed securities (including pledged of $ |
|||||||||||
| Due from counterparties | |||||||||||
| Derivative assets | |||||||||||
| Accrued interest receivable | |||||||||||
Other assets |
|||||||||||
| Total assets | $ | $ | |||||||||
| LIABILITIES AND SHAREHOLDERS’ EQUITY | |||||||||||
| Liabilities: | |||||||||||
| Repurchase agreements | $ | $ | |||||||||
| Due to counterparties | |||||||||||
| Derivative liabilities | |||||||||||
| Cash collateral posted by counterparties | |||||||||||
| Accrued interest payable | |||||||||||
| Accrued dividends payable | |||||||||||
| Other liabilities | |||||||||||
| Total liabilities | |||||||||||
| Shareholders’ equity: | |||||||||||
Preferred stock, par value $ |
|||||||||||
|
Common stock, par value $
|
|||||||||||
| Additional paid-in capital | |||||||||||
| Accumulated other comprehensive loss | ( |
( |
|||||||||
| Accumulated deficit | ( |
( |
|||||||||
| Total shareholders’ equity | |||||||||||
| Total liabilities and shareholders’ equity | $ | $ | |||||||||
See notes to the consolidated financial statements (unaudited).
1
DYNEX CAPITAL, INC.
CONSOLIDATED STATEMENTS OF COMPREHENSIVE INCOME (LOSS)
(UNAUDITED)
($s in thousands except per share data)
| Three Months Ended | Six Months Ended | ||||||||||||||||||||||
| June 30, | June 30, | ||||||||||||||||||||||
| 2025 | 2024 | 2025 | 2024 | ||||||||||||||||||||
| INTEREST INCOME (EXPENSE) | |||||||||||||||||||||||
| Interest income | $ | $ | $ | $ | |||||||||||||||||||
| Interest expense | ( |
( |
( |
( |
|||||||||||||||||||
Net interest income (expense) |
( |
||||||||||||||||||||||
| OTHER GAINS (LOSSES) | |||||||||||||||||||||||
Realized loss on sales of investments, net |
— | ( |
— | ( |
|||||||||||||||||||
| Unrealized gain (loss) on investments, net | ( |
( |
|||||||||||||||||||||
| (Loss) gain on derivative instruments, net | ( |
( |
|||||||||||||||||||||
Total other (loss) gains, net |
( |
( |
( |
||||||||||||||||||||
| EXPENSES | |||||||||||||||||||||||
| Compensation and benefits | ( |
( |
( |
( |
|||||||||||||||||||
| Other general and administrative | ( |
( |
( |
( |
|||||||||||||||||||
| Other operating expenses | ( |
( |
( |
( |
|||||||||||||||||||
| Total operating expenses | ( |
( |
( |
( |
|||||||||||||||||||
Net (loss) income |
( |
( |
( |
||||||||||||||||||||
| Preferred stock dividends | ( |
( |
( |
( |
|||||||||||||||||||
Net (loss) income to common shareholders |
$ | ( |
$ | ( |
$ | ( |
$ | ||||||||||||||||
| Other comprehensive income: | |||||||||||||||||||||||
Unrealized gain (loss) on available-for-sale investments, net |
$ | $ | ( |
$ | $ | ( |
|||||||||||||||||
| Total other comprehensive income (loss) | ( |
( |
|||||||||||||||||||||
Comprehensive (loss) income to common shareholders |
$ | ( |
$ | ( |
$ | $ | |||||||||||||||||
| Weighted average common shares-basic | |||||||||||||||||||||||
| Weighted average common shares-diluted | |||||||||||||||||||||||
Net (loss) income per common share-basic |
$ | ( |
$ | ( |
$ | ( |
$ | ||||||||||||||||
Net (loss) income per common share-diluted |
$ | ( |
$ | ( |
$ | ( |
$ | ||||||||||||||||
See notes to the consolidated financial statements (unaudited).
2
DYNEX CAPITAL, INC.
CONSOLIDATED STATEMENTS OF SHAREHOLDERS’ EQUITY
(UNAUDITED)
($s in thousands)
For the Three and Six Months Ended June 30, 2025 | |||||||||||||||||||||||||||||||||||||||||
| Preferred Stock | Common Stock | Additional Paid-in Capital |
Accumulated Other Comprehensive Loss | Accumulated Deficit |
Total Shareholders’ Equity | ||||||||||||||||||||||||||||||||||||
| Shares | Amount | Shares | Amount | ||||||||||||||||||||||||||||||||||||||
| Balance as of March 31, 2025 |
$ | $ | $ | $ | ( |
$ | ( |
$ | |||||||||||||||||||||||||||||||||
| Stock issuance | — | — | — | — | |||||||||||||||||||||||||||||||||||||
| Restricted stock granted, net of amortization | — | — | — | — | |||||||||||||||||||||||||||||||||||||
| Other share-based compensation, net of amortization | — | — | — | — | |||||||||||||||||||||||||||||||||||||
| Stock issuance costs | — | — | — | — | ( |
— | — | ( |
|||||||||||||||||||||||||||||||||
| Net loss | — | — | — | — | — | — | ( |
( |
|||||||||||||||||||||||||||||||||
| Dividends on preferred stock | — | — | — | — | — | — | ( |
( |
|||||||||||||||||||||||||||||||||
| Dividends on common stock | — | — | — | — | — | — | ( |
( |
|||||||||||||||||||||||||||||||||
| Other comprehensive income | — | — | — | — | — | — | |||||||||||||||||||||||||||||||||||
| Balance as of June 30, 2025 |
$ | $ | $ | $ | ( |
$ | ( |
$ | |||||||||||||||||||||||||||||||||
| Balance as of December 31, 2024 |
$ | $ | $ | $ | ( |
$ | ( |
$ | |||||||||||||||||||||||||||||||||
| Stock issuance | — | — | — | — | |||||||||||||||||||||||||||||||||||||
| Restricted stock granted, net of amortization | — | — | — | — | |||||||||||||||||||||||||||||||||||||
| Other share-based compensation, net of amortization | — | — | — | — | |||||||||||||||||||||||||||||||||||||
| Adjustments for tax withholding on share-based compensation | — | — | ( |
( |
( |
— | — | ( |
|||||||||||||||||||||||||||||||||
| Stock issuance costs | — | — | — | — | ( |
— | — | ( |
|||||||||||||||||||||||||||||||||
| Net loss | — | — | — | — | — | — | ( |
( |
|||||||||||||||||||||||||||||||||
| Dividends on preferred stock | — | — | — | — | — | — | ( |
( |
|||||||||||||||||||||||||||||||||
| Dividends on common stock | — | — | — | — | — | — | ( |
( |
|||||||||||||||||||||||||||||||||
| Other comprehensive income | — | — | — | — | — | — | |||||||||||||||||||||||||||||||||||
| Balance as of June 30, 2025 |
$ | $ | $ | $ | ( |
$ | ( |
$ | |||||||||||||||||||||||||||||||||
3
For the Three and Six Months Ended June 30, 2024 | |||||||||||||||||||||||||||||||||||||||||
| Preferred Stock | Common Stock | Additional Paid-in Capital |
Accumulated Other Comprehensive Loss | Accumulated Deficit |
Total Shareholders’ Equity | ||||||||||||||||||||||||||||||||||||
| Shares | Amount | Shares | Amount | ||||||||||||||||||||||||||||||||||||||
| Balance as of March 31, 2024 | $ | $ | $ | $ | ( |
$ | ( |
$ | |||||||||||||||||||||||||||||||||
| Stock issuance | — | — | — | — | |||||||||||||||||||||||||||||||||||||
| Restricted stock granted, net of amortization | — | — | — | — | |||||||||||||||||||||||||||||||||||||
| Other share-based compensation, net of amortization | — | — | — | — | |||||||||||||||||||||||||||||||||||||
| Stock issuance costs | — | — | ( |
— | — | ( |
|||||||||||||||||||||||||||||||||||
| Net loss | — | — | — | — | — | — | ( |
( |
|||||||||||||||||||||||||||||||||
| Dividends on preferred stock | — | — | — | — | — | — | ( |
( |
|||||||||||||||||||||||||||||||||
| Dividends on common stock | — | — | — | — | — | — | ( |
( |
|||||||||||||||||||||||||||||||||
Other comprehensive loss |
— | — | — | — | — | ( |
— | ( |
|||||||||||||||||||||||||||||||||
| Balance as of June 30, 2024 | $ | $ | $ | $ | ( |
$ | ( |
$ | |||||||||||||||||||||||||||||||||
| Balance as of December 31, 2023 |
$ | $ | $ | $ | ( |
$ | ( |
$ | |||||||||||||||||||||||||||||||||
| Stock issuance | — | — | — | — | |||||||||||||||||||||||||||||||||||||
| Restricted stock granted, net of amortization | — | — | — | — | |||||||||||||||||||||||||||||||||||||
| Other share-based compensation, net of amortization | — | — | — | — | |||||||||||||||||||||||||||||||||||||
| Adjustments for tax withholding on share-based compensation | — | — | ( |
( |
— | — | ( |
||||||||||||||||||||||||||||||||||
| Stock issuance costs | — | — | — | — | ( |
— | — | ( |
|||||||||||||||||||||||||||||||||
Net income |
— | — | — | — | — | — | |||||||||||||||||||||||||||||||||||
| Dividends on preferred stock | — | — | — | — | — | — | ( |
( |
|||||||||||||||||||||||||||||||||
| Dividends on common stock | — | — | — | — | — | — | ( |
( |
|||||||||||||||||||||||||||||||||
Other comprehensive loss |
— | — | — | — | — | ( |
— | ( |
|||||||||||||||||||||||||||||||||
| Balance as of June 30, 2024 | $ | $ | $ | $ | ( |
$ | ( |
$ | |||||||||||||||||||||||||||||||||
See notes to the consolidated financial statements (unaudited).
4
DYNEX CAPITAL, INC.
CONSOLIDATED STATEMENTS OF CASH FLOWS
(UNAUDITED)
($s in thousands)
| Six Months Ended | |||||||||||
| June 30, | |||||||||||
| 2025 | 2024 | ||||||||||
| Operating activities: | |||||||||||
| Net (loss) income | $ | ( |
$ | ||||||||
Adjustments to reconcile net (loss) income to cash provided by operating activities: |
|||||||||||
Realized loss on sales of investments, net |
|||||||||||
Unrealized (gain) loss on investments, net |
( |
||||||||||
Loss (gain) on derivative instruments, net |
( |
||||||||||
| Amortization of investment premiums, net | |||||||||||
Other amortization and depreciation |
|||||||||||
| Share-based compensation expense | |||||||||||
| (Increase) decrease in accrued interest receivable | ( |
||||||||||
| Increase in accrued interest payable | |||||||||||
| Change in other assets and liabilities, net | ( |
( |
|||||||||
| Net cash provided by operating activities | |||||||||||
| Investing activities: | |||||||||||
| Purchases of investments | ( |
( |
|||||||||
| Principal payments received on trading securities | |||||||||||
| Principal payments received on available-for-sale investments | |||||||||||
| Proceeds from sales of trading securities | |||||||||||
| Principal payments received on mortgage loans held for investment | |||||||||||
Net (payments) receipts on derivative instruments |
( |
||||||||||
Increase (decrease) in cash collateral posted by counterparties |
( |
||||||||||
| Net cash used in investing activities | ( |
( |
|||||||||
| Financing activities: | |||||||||||
| Borrowings under repurchase agreements | |||||||||||
| Repayments of repurchase agreement borrowings | ( |
( |
|||||||||
| Proceeds from issuance of common stock | |||||||||||
| Payments related to tax withholding for share-based compensation | ( |
( |
|||||||||
| Dividends paid | ( |
( |
|||||||||
| Net cash provided by financing activities | |||||||||||
Net increase in cash, including cash posted to counterparties |
|||||||||||
| Cash including cash posted to counterparties at beginning of period | |||||||||||
| Cash including cash posted to counterparties at end of period | $ | $ | |||||||||
| Supplemental Disclosure of Cash Activity: | |||||||||||
| Cash paid for interest | $ | $ | |||||||||
See notes to the consolidated financial statements (unaudited).
5
DYNEX CAPITAL, INC.
NOTES TO THE CONSOLIDATED FINANCIAL STATEMENTS
(UNAUDITED)
NOTE 1 – ORGANIZATION AND SUMMARY OF SIGNIFICANT ACCOUNTING POLICIES
Organization
Dynex Capital, Inc. (the “Company”) was incorporated in the Commonwealth of Virginia on December 18, 1987 and commenced operations in February 1988. The Company is an internally managed mortgage real estate investment trust, or mortgage REIT, which primarily earns income from investing on a leveraged basis in Agency mortgage-backed securities (“Agency MBS”) and in to-be-announced securities (“TBAs” or “TBA securities”). Agency MBS have a guaranty of principal and interest payments by a U.S. government-sponsored entity (“GSE”) such as Fannie Mae and Freddie Mac, which are in conservatorship and are currently supported by a senior preferred stock purchase agreement from the U.S. Treasury. As of June 30, 2025, the majority of the Company’s Agency MBS are secured by residential real property (“Agency RMBS”). The remainder of the Company’s investments are in Agency commercial MBS (“Agency CMBS”) and in both Agency and non-Agency CMBS interest-only (“CMBS IO”). Non-Agency MBS do not have a GSE guaranty of principal or interest payments.
Basis of Presentation
Use of Estimates
Consolidation and Variable Interest Entities
The consolidated financial statements include the accounts of the Company and the accounts of its majority owned subsidiaries and variable interest entities (“VIE”) for which it is the primary beneficiary. The Company consolidates a VIE if the Company is determined to be the VIE’s primary beneficiary, which is defined as the party that has both (i) the power to control the activities that most significantly impact the VIE’s financial performance; and (ii) the right to receive benefits or absorb losses that could potentially be significant to the VIE. The Company reconsiders its evaluation of whether to consolidate a VIE on an ongoing basis, based on changes in the facts and circumstances pertaining to the VIE. Though the Company invests in Agency and non-Agency MBS which are generally considered to be interests in VIEs, the Company does not consolidate these entities because it does not meet the criteria to be deemed the primary beneficiary. The maximum exposure to loss for these VIEs is the carrying value of the MBS.
6
DYNEX CAPITAL, INC.
NOTES TO THE CONSOLIDATED FINANCIAL STATEMENTS
(UNAUDITED)
Income Taxes
The Company has elected to be taxed as a real estate investment trust (“REIT”) under the Internal Revenue Code of 1986 (the “Tax Code”) and the corresponding provisions of state law. To qualify as a REIT, the Company must meet certain asset, income, ownership, and distribution tests. To meet these requirements, the Company’s main source of income is interest earned from obligations secured by mortgages on real property, and the Company must distribute at least 90% of its annual REIT taxable income to shareholders. The Company’s income will generally not be subject to federal income tax to the extent its income is distributed as dividends to shareholders.
The Company assesses its tax positions for all open tax years and determines whether the Company has any material unrecognized liabilities and records these liabilities, if any, to the extent they are deemed more likely than not to have been incurred.
Net Income (Loss) Per Common Share
The Company calculates basic net income (loss) per common share by dividing net income (loss) to common shareholders for the period by weighted-average shares of common stock outstanding for that period. Please see Note 2 for the calculation of the Company’s basic and diluted net income (loss) per common share for the periods indicated.
The Company currently has restricted stock, service-based restricted stock units (“RSUs”) and performance-based stock units (“PSUs”) issued and outstanding. Restricted stock awards issued under the Company’s 2020 Stock and Incentive Plan (the “2020 Plan”) are considered participating securities and therefore are included in the computation of basic net income per common share using the two-class method because holders of unvested shares of restricted stock issued under the 2020 Plan are eligible to receive non-forfeitable dividends. Holders of RSUs and PSUs accrue forfeitable dividend equivalent rights over the period outstanding, receiving dividend payments only upon the settlement date if the requisite service-based and performance-based conditions have been achieved, as applicable. As such, RSUs and PSUs are excluded from the computation of basic net income per common share but are included in the computation of diluted net income per common share unless the effect is to reduce a net loss or increase the net income per common share (also known as “anti-dilutive”). Upon vesting, restrictions on transfer expire on each share of restricted stock, RSU, and PSU, and each such share or unit becomes one unrestricted share of common stock and is included in the computation of basic net income per common share.
Because the Company’s Series C Preferred Stock is redeemable at the Company’s option for cash only and convertible into shares of common stock only upon a change of control of the Company (and subject to other circumstances) as described in Article IIIC of the Company’s Restated Articles of Incorporation, as amended, the effect of those shares and their related dividends are excluded from the calculation of diluted net income per common share for the periods presented.
Cash and Cash Equivalents
Cash and cash equivalents include unrestricted demand deposits at highly rated financial institutions and highly liquid investments with original maturities of three months or less. The Company’s cash balances fluctuate throughout the year and may exceed Federal Deposit Insurance Corporation (“FDIC”) insured limits from time to time. Although the Company bears risk to amounts in excess of those insured by the FDIC, the Company believes the risk of loss is mitigated by the financial position, creditworthiness, and strength of the depository institutions in which those deposits are held.
Cash Collateral Posted To/By Counterparties
The Company regularly pledges and receives amounts to cover margin requirements related to the Company’s financing and derivative instruments. If the amount pledged to a counterparty exceeds the amount received from a counterparty, the net amount is recorded as an asset within “cash collateral posted to counterparties,” and if the amount received from a counterparty exceeds the amount pledged to a counterparty, the net amount is recorded as a liability within “cash collateral posted by counterparties” on the Company’s consolidated balance sheets.
7
DYNEX CAPITAL, INC.
NOTES TO THE CONSOLIDATED FINANCIAL STATEMENTS
(UNAUDITED)
The following table provides a reconciliation of “cash” and “cash posted to counterparties” reported on the Company's consolidated balance sheets presented herein that sum to the total of the same such amounts shown on the Company’s consolidated statement of cash flows for the six months ended June 30, 2025:
($s in thousands) |
June 30, 2025 | ||||
| Cash and cash equivalents | $ | ||||
| Cash collateral posted to counterparties | |||||
| Total cash including cash posted to counterparties shown on consolidated statement of cash flows | $ | ||||
Mortgage-Backed Securities
The Company’s MBS are recorded at fair value on the Company’s consolidated balance sheet. Changes in fair value of MBS purchased prior to January 1, 2021 are designated as available-for-sale (“AFS”) with changes in fair value reported in other comprehensive income (“OCI”) as an unrealized gain (loss) until the security is sold or matures. Effective January 1, 2021, the Company elected the fair value option (“FVO”) for all MBS purchased on or after that date with changes in fair value reported in net income as “unrealized gain (loss) on investments, net” until the security is sold or matures. Management elected the fair value option so that net income will reflect the changes in fair value for its future purchases of MBS in a manner consistent with the presentation and timing of the changes in fair value of its derivative instruments. Upon the sale of an MBS, any unrealized gain or loss within OCI or net income is reclassified to “realized gain (loss) on sale of investments, net” within net income using the specific identification method.
Interest Income, Premium Amortization, and Discount Accretion. Interest income on MBS is accrued based on the outstanding principal balance (or notional balance in the case of IO securities) and the contractual terms. Premiums or discounts associated with the purchase of Agency MBS as well as any non-Agency MBS are amortized or accreted into interest income over the life of such securities using the effective interest method, and adjustments to premium amortization and discount accretion are made for actual cash payments received. On at least a quarterly basis, the Company reviews and makes any necessary adjustments to its cash flows and updates the yield recognized on these assets.
Determination of MBS Fair Value. The Company estimates the fair value of the majority of its MBS based upon prices obtained from an independent third-party pricing service. These prices are assessed for reasonableness using broker quotes and other third-party pricing services. Please refer to Note 6 for further discussion of MBS fair value measurements.
Allowance for Credit Losses. On at least a quarterly basis, the Company evaluates any MBS designated as AFS with a fair value less than its amortized cost for credit losses. If the difference between the present value of cash flows expected to be collected on the MBS is less than its amortized cost, the difference is recorded as an allowance for credit loss through net income up to and not exceeding the amount that the amortized cost exceeds current fair value. Subsequent changes in credit loss estimates are recognized in earnings in the period in which they occur. Because the majority of the Company’s investments are higher credit quality and most are guaranteed by a GSE, the Company is not likely to have an allowance for credit losses related to its MBS recorded on its consolidated balance sheet.
Interest accrued between payment dates on MBS is presented separately from the Company’s investment portfolio as “accrued interest receivable” on its consolidated balance sheet. The Company does not estimate an allowance for credit loss for its accrued interest receivable because the interest is generally received within 30 days and amounts not received when due are written off against interest income.
Repurchase Agreements
The Company’s repurchase agreements are used to finance its purchases of MBS. The Company pledges its securities as collateral to secure a loan, which is equal to a specified percentage of the estimated fair value of the pledged collateral. The Company retains beneficial ownership of the pledged collateral. Pursuant to Accounting Standards Codification (“ASC”) Topic 860, the Company accounts for repurchase agreements as collateralized
8
DYNEX CAPITAL, INC.
NOTES TO THE CONSOLIDATED FINANCIAL STATEMENTS
(UNAUDITED)
financing transactions, which are carried at their contractual amounts (cost), plus accrued interest. The interest rates the Company pays for these borrowings are based on a spread added to the Secured Overnight Funding Rate (“SOFR”). At the maturity of a repurchase agreement borrowing, the Company is required to repay the loan and concurrently receives back its pledged collateral from the lender, or, with the consent of the lender, the Company may renew the agreement at the then prevailing financing rate. A repurchase agreement lender may require the Company to pledge additional collateral in the event of a decline in the fair value of the collateral pledged. Repurchase agreement financing is recourse to the Company and the assets pledged. The repurchase facilities available to the Company are uncommitted with no guarantee of renewal.
Derivative Instruments
Derivatives are carried at fair value, and all periodic interest benefits/costs and changes in the fair value of derivative instruments, including gains and losses realized upon termination, maturity, or settlement, are recorded in “gain (loss) on derivative instruments, net” on the Company’s consolidated statements of comprehensive income (loss). Cash receipts and payments related to derivative instruments are classified in the investing activities section of the consolidated statements of cash flows in accordance with the underlying nature or purpose of the derivative transactions.
The Company’s short positions in U.S. Treasury futures contracts are centrally cleared through the Chicago Mercantile Exchange (“CME”), which requires the Company to post initial margin as determined by the CME. Daily variation margin is exchanged, typically in cash, for the changes in the fair value of the futures contracts, which is treated as legal settlement of the exposure under the related futures contracts as opposed to a pledge of collateral. The effect of these legal settlements reduces what would have otherwise been reported as the fair value of the futures contracts, generally to $0. The margin requirement varies based on the market value of the open positions and the equity retained in the account. Any margin excess or deficit outstanding is recorded as a receivable or payable within “due from/to counterparties” as of the date of the Company’s consolidated balance sheets. The Company realizes gains or losses on these contracts upon expiration at an amount equal to the difference between the current fair value of the underlying asset and the contractual price of the futures contract.
The Company’s interest rate swaps are pay-fixed, which involve the receipt of variable-rate amounts based on SOFR from a counterparty in exchange for the Company making fixed-rate payments over the life of the interest rate swap without exchange of the underlying notional amount. The net periodic interest benefit (cost) is recorded in the period earned (incurred) in “gain (loss) on derivative instruments, net”, but the net receipt (payment) of cash is exchanged annually, typically on the anniversary of each agreement’s effective date. Like the Company’s U.S. Treasury futures, interest rate swap agreements are centrally cleared through the CME with requirements to post initial margin and to exchange daily variation margin amounts, which are treated as legal settlements of the agreements. Any margin excess or deficit outstanding is recorded as a receivable or payable within “due from/to counterparties” as of the date of the Company’s consolidated balance sheets.
The Company’s interest rate swaptions are SOFR-based and provide the Company the right, but not the obligation, to enter into an interest rate swap at a predetermined notional amount with a stated term and pay and receive rates in the future. These agreements are entered into directly with a counterparty (a “bilateral contract”) with whom we may exchange margin collateral. Because these agreements are not centrally cleared, the Company has exposure to counterparty risk. The Company records the premium it will pay for the swaption as a derivative asset on its consolidated balance sheet and adjusts the balance for changes in fair value through “gain (loss) on derivative instruments” until the swaption is exercised or the contract expires. If the swaption expires unexercised, the realized loss is limited to the premium paid. If exercised, the realized gain or loss on the swaptions is equal to the difference between the fair value of the underlying interest rate swap and the premium paid.
The Company may also use options on U.S. Treasury futures, and the accounting for these instruments is similar to its interest rate swaptions.
The Company purchases TBA securities as a means of investing in non-specified fixed-rate Agency RMBS and may also periodically sell TBA securities as a means of economically hedging its exposure to Agency RMBS. A TBA security is a forward contract (“TBA contract”) for the purchase (“long position”) or sale (“short position”) of a non-specified Agency MBS at a predetermined price with certain principal and interest terms and certain types of collateral, but the particular Agency securities to be delivered are not identified until shortly before the settlement
9
DYNEX CAPITAL, INC.
NOTES TO THE CONSOLIDATED FINANCIAL STATEMENTS
(UNAUDITED)
date. The Company accounts for long and short positions in Agency RMBS TBAs as derivative instruments in accordance with ASC 815 because the Company cannot assert that it is probable at inception and throughout the term of an individual TBA transaction that its settlement will result in physical delivery of the underlying Agency RMBS or that the individual TBA transaction will settle in the shortest time period possible.
Share-Based Compensation
The Company’s Board of Directors adopted the 2025 Stock and Incentive Plan (the “2025 Plan”), which was approved by the Company’s shareholders on May 20, 2025. The 2025 Plan, which replaced the Company’s 2020 Plan, reserves for issuance up to 12,000,000 common shares for eligible employees, non-employee directors, consultants, and advisors to the Company to be granted in the form of stock options, restricted stock, RSUs, stock appreciation rights, PSU, and performance-based cash awards (collectively, “awards”). Awards previously granted under the 2020 Plan will remain outstanding and valid in accordance with their terms, but no new awards will be granted under the 2020 Plan. As of June 30, 2025, there were 11,382,492 common shares remaining available for issuance under the 2025 Plan.
The Company has issued restricted stock and RSUs, which are treated as equity awards and recorded at their fair value using the closing stock price on the grant date. Compensation expense is generally recognized over a service period specified within each award with a corresponding credit to shareholders’ equity using the straight-line method until the vesting date specified within each award or until the employee becomes eligible for retirement, if earlier than the vesting date. Compensation expense is recognized immediately upon the grant date for equity awards granted to an employee who is retirement eligible.
The Company also has PSUs issued and outstanding which contain Company performance-based and market performance-based conditions. PSUs subject to Company performance-based conditions are initially recognized as equity at their fair value which is measured using the closing stock price on the grant date multiplied by the number of units expected to vest based on an assessment of the probability of achievement of the Company performance-based conditions as of the grant date. The grant date fair value is recognized as expense using the straight-line method until the earlier of the vesting date specified within each award or the date the employee becomes eligible for retirement. Adjustments are made, if necessary, based on any change in probability of achievement which is re-assessed as of each reporting date and on at least a quarterly basis. PSUs subject to market performance-based conditions are recognized as equity at their grant date fair value determined through a Monte-Carlo simulation of the Company’s common stock total shareholder return (“TSR”) relative to the common stock TSR of the group of peer companies specified in the award agreement. Awards subject to market performance-based conditions are not assessed for probability of achievement and are not remeasured subsequent to issuance. The grant date fair value is recognized as expense using the straight-line method until the earlier of the vesting date specified within each award or the date the employee becomes eligible for retirement, even if the market performance-based conditions are not achieved. The Company no longer has any market performance-based PSUs outstanding as of June 30, 2025.
The Company does not estimate forfeitures for any of its share-based compensation awards but adjusts for actual forfeitures in the periods in which they occur. Because RSUs and PSUs have forfeitable dividend equivalent rights, which are paid in cash only upon settlement, any accrued dividend equivalent rights (“DERs”) on forfeited units are reversed with a corresponding credit to “Compensation and benefits” expense.
Contingencies
The Company did not have any pending lawsuits, claims, or other contingencies as of June 30, 2025 or December 31, 2024.
10
DYNEX CAPITAL, INC.
NOTES TO THE CONSOLIDATED FINANCIAL STATEMENTS
(UNAUDITED)
Recently Issued Accounting Pronouncements
The Company evaluates Accounting Standards Updates (“ASU”) issued by the Financial Accounting Standards Board on at least a quarterly basis to evaluate applicability and significance of any impact on its financial condition and results of operations. There were no accounting pronouncements issued during the six months ended June 30, 2025, that are expected to have a material impact on the Company’s financial condition or results of operations.
NOTE 2 – NET INCOME (LOSS) PER COMMON SHARE
Please refer to Note 1 for information regarding the Company’s treatment of its preferred stock and stock awards in the calculation of its basic and diluted net income or loss per common share and to Note 7 for information regarding the Company’s stock award activity for the periods presented. The following table presents the computations of basic and diluted net income or loss per common share for the periods indicated:
| Three Months Ended | Six Months Ended | ||||||||||||||||||||||
| June 30, | June 30, | ||||||||||||||||||||||
($s in thousands) |
2025 | 2024 | 2025 | 2024 | |||||||||||||||||||
| Weighted average number of common shares outstanding - basic | |||||||||||||||||||||||
| Incremental common shares-unvested RSUs | |||||||||||||||||||||||
| Incremental common shares-unvested PSUs | |||||||||||||||||||||||
| Weighted average number of common shares outstanding - diluted | |||||||||||||||||||||||
| Net (loss) income to common shareholders | $ | ( |
$ | ( |
$ | ( |
$ | ||||||||||||||||
| Net (loss) income per common share-basic | $ | ( |
$ | ( |
$ | ( |
$ | ||||||||||||||||
| Net (loss) income per common share-diluted | $ | ( |
$ | ( |
$ | ( |
$ | ||||||||||||||||
The calculation of diluted net loss per common share for the three and six months ended June 30, 2025 and for the three months ended June 30, 2024 excludes unvested RSUs and PSUs of 687,571 , 651,200 , and 1,110,206 , respectively, which would have been anti-dilutive for the period.
11
DYNEX CAPITAL, INC.
NOTES TO THE CONSOLIDATED FINANCIAL STATEMENTS
(UNAUDITED)
NOTE 3 – MORTGAGE-BACKED SECURITIES
The following tables provide details on the Company’s MBS by investment type as of the dates indicated:
| June 30, 2025 | |||||||||||||||||||||||
($s in thousands) |
Agency RMBS |
Agency CMBS |
CMBS IO (1)
|
Total |
|||||||||||||||||||
Measured at fair value through net income: |
|||||||||||||||||||||||
Amortized cost |
$ | $ | $ | $ | |||||||||||||||||||
Gross unrealized gain |
|||||||||||||||||||||||
Gross unrealized loss |
( |
( |
( |
( |
|||||||||||||||||||
Fair value through net income |
$ | $ | $ | $ | |||||||||||||||||||
Measured at fair value through OCI: |
|||||||||||||||||||||||
Amortized cost |
$ | $ | $ | $ | |||||||||||||||||||
Gross unrealized gain |
|||||||||||||||||||||||
Gross unrealized loss |
( |
( |
( |
( |
|||||||||||||||||||
Fair value through OCI |
$ | $ | $ | $ | |||||||||||||||||||
| Total | $ | $ | $ | $ | |||||||||||||||||||
| December 31, 2024 | |||||||||||||||||||||||
Agency RMBS |
Agency CMBS |
CMBS IO (1)
|
Total |
||||||||||||||||||||
Measured at fair value through net income: |
|||||||||||||||||||||||
Amortized cost |
$ | $ | $ | $ | |||||||||||||||||||
Gross unrealized gain |
|||||||||||||||||||||||
Gross unrealized loss |
( |
( |
( |
||||||||||||||||||||
Fair value through net income |
$ | $ | $ | $ | |||||||||||||||||||
Measured at fair value through OCI: |
|||||||||||||||||||||||
Amortized cost |
$ | $ | $ | $ | |||||||||||||||||||
Gross unrealized gain |
|||||||||||||||||||||||
Gross unrealized loss |
( |
( |
( |
( |
|||||||||||||||||||
Fair value through OCI |
$ | $ | $ | $ | |||||||||||||||||||
| Total | $ | $ | $ | $ | |||||||||||||||||||
(1) The notional balance for Agency CMBS IO and non-Agency CMBS IO was $ | |||||||||||||||||||||||
The majority of the Company’s MBS are pledged as collateral for the Company’s repurchase agreements, which are disclosed in Note 4. Actual maturities of MBS are affected by the contractual lives of the underlying mortgage collateral, scheduled payments and unscheduled prepayments of principal, and the payment priority structure of the security; therefore, actual maturities are generally shorter than the securities' stated contractual maturities.
12
DYNEX CAPITAL, INC.
NOTES TO THE CONSOLIDATED FINANCIAL STATEMENTS
(UNAUDITED)
The following table presents information regarding unrealized gains and losses on investments reported within net income (loss) on the Company’s consolidated statements of comprehensive income (loss) for the periods indicated:
| Three Months Ended | Six Months Ended | ||||||||||||||||||||||
| June 30, | June 30, | ||||||||||||||||||||||
($s in thousands) |
2025 | 2024 | 2025 | 2024 | |||||||||||||||||||
| Agency RMBS | $ | $ | ( |
$ | $ | ( |
|||||||||||||||||
| Agency CMBS | |||||||||||||||||||||||
| CMBS IO | |||||||||||||||||||||||
Other investments |
( |
( |
|||||||||||||||||||||
| Unrealized gain (loss) on investments, net | $ | $ | ( |
$ | $ | ( |
|||||||||||||||||
| Three Months Ended | Six Months Ended | ||||||||||||||||||||||
| June 30, | June 30, | ||||||||||||||||||||||
($s in thousands) |
2025 | 2024 | 2025 | 2024 | |||||||||||||||||||
| Realized losses on sales of MBS - FVO | $ | $ | ( |
$ | $ | ( |
|||||||||||||||||
Total realized loss on sales of investments, net |
$ | $ | ( |
$ | $ | ( |
|||||||||||||||||
The following table presents certain information for MBS designated as AFS that were in an unrealized loss position as of the dates indicated:
| June 30, 2025 | December 31, 2024 | |||||||||||||||||||||||||||||||||||||
($s in thousands) |
Fair Value | Gross Unrealized Losses | # of Securities | Fair Value | Gross Unrealized Losses | # of Securities | ||||||||||||||||||||||||||||||||
| Continuous unrealized loss position for less than 12 months: | ||||||||||||||||||||||||||||||||||||||
| Agency MBS | $ | $ | $ | $ | ( |
|||||||||||||||||||||||||||||||||
| Non-Agency MBS | ( |
( |
||||||||||||||||||||||||||||||||||||
| Continuous unrealized loss position for 12 months or longer: | ||||||||||||||||||||||||||||||||||||||
| Agency MBS | $ | $ | ( |
$ | $ | ( |
||||||||||||||||||||||||||||||||
| Non-Agency MBS | ( |
( |
||||||||||||||||||||||||||||||||||||
13
DYNEX CAPITAL, INC.
NOTES TO THE CONSOLIDATED FINANCIAL STATEMENTS
(UNAUDITED)
NOTE 4 – REPURCHASE AGREEMENTS
The Company’s repurchase agreements outstanding as of June 30, 2025 and December 31, 2024 are summarized in the following tables:
| June 30, 2025 | December 31, 2024 | |||||||||||||||||||||||||||||||||||||
| Collateral Type | Balance | Weighted Average Rate |
Fair Value of Collateral Pledged |
Balance | Weighted Average Rate |
Fair Value of Collateral Pledged |
||||||||||||||||||||||||||||||||
($s in thousands) |
||||||||||||||||||||||||||||||||||||||
| Agency RMBS | $ | % | $ | $ | % | $ | ||||||||||||||||||||||||||||||||
| Agency CMBS | % | % | ||||||||||||||||||||||||||||||||||||
| Agency CMBS IO | % | % | ||||||||||||||||||||||||||||||||||||
| Non-Agency CMBS IO | % | % | ||||||||||||||||||||||||||||||||||||
Total |
$ | % | $ | $ | % | $ | ||||||||||||||||||||||||||||||||
The Company had borrowings outstanding under 27 different repurchase agreements as of June 30, 2025, and its equity at risk did not exceed 10% with any counterparty as of that date. The Company also had $939 million recorded as a payable within “due to counterparties” for transactions pending settlement as of June 30, 2025 and $342 million as of December 31, 2024.
The following table provides information on the remaining term to maturity and original term to maturity for the Company’s repurchase agreements as of the dates indicated:
| June 30, 2025 | December 31, 2024 | |||||||||||||||||||||||||||||||||||||
| Remaining Term to Maturity | Balance | Weighted Average Rate |
WAVG Original Term to Maturity | Balance | Weighted Average Rate |
WAVG Original Term to Maturity | ||||||||||||||||||||||||||||||||
($s in thousands) |
||||||||||||||||||||||||||||||||||||||
| Less than 30 days | $ | % | $ | % | ||||||||||||||||||||||||||||||||||
| 30 to 90 days | % | % | ||||||||||||||||||||||||||||||||||||
| 91 to 180 days | % | % | ||||||||||||||||||||||||||||||||||||
| Total | $ | % | $ | % | ||||||||||||||||||||||||||||||||||
The Company’s accrued interest payable related to its repurchase agreement borrowings increased to $61 million as of June 30, 2025 from $45 million as of December 31, 2024.
The Company’s counterparties, as set forth in the master repurchase agreement with the counterparty, require the Company to comply with various customary operating and financial covenants, including, but not limited to, minimum net worth, maximum declines in net worth in a given period, and maximum leverage requirements as well as maintaining the Company’s REIT status. In addition, some of the agreements contain cross default features, whereby default under an agreement with one lender simultaneously causes default under agreements with other lenders. To the extent that the Company fails to comply with the covenants contained in these financing agreements or is otherwise found to be in default under the terms of such agreements, the counterparty has the right to accelerate amounts due under the master repurchase agreement. The Company believes it was in full compliance with all covenants in master repurchase agreements under which there were amounts outstanding as of June 30, 2025.
The Company's repurchase agreements are subject to underlying agreements with master netting or similar arrangements, which provide for the right of set off in the event of default or in the event of bankruptcy of either party to the transactions. The Company reports its repurchase agreements to these arrangements on a gross basis. The following table presents information regarding the Company's repurchase agreements as if the Company had
14
DYNEX CAPITAL, INC.
NOTES TO THE CONSOLIDATED FINANCIAL STATEMENTS
(UNAUDITED)
presented them on a net basis as of June 30, 2025 and December 31, 2024:
($s in thousands) |
Gross Amount of Recognized Liabilities | Gross Amount Offset in the Balance Sheet | Net Amount of Liabilities Presented in the Balance Sheet |
Gross Amount Not Offset in the Balance Sheet (1)
|
Net Amount | ||||||||||||||||||||||||||||||
| Financial Instruments Posted as Collateral | Cash Posted as Collateral | ||||||||||||||||||||||||||||||||||
| June 30, 2025: | |||||||||||||||||||||||||||||||||||
| Repurchase agreements | $ | $ | $ | $ | ( |
$ | $ | ||||||||||||||||||||||||||||
| December 31, 2024: | |||||||||||||||||||||||||||||||||||
| Repurchase agreements | $ | $ | $ | $ | ( |
$ | $ | ||||||||||||||||||||||||||||
(1) Amounts disclosed for collateral received by or posted to the same counterparty include cash and the fair value of MBS up to and not exceeding the net amount of the repurchase agreement liability presented in the balance sheet. The fair value of the total collateral received by or posted to the same counterparty may exceed the amounts presented. Please refer to the consolidated balance sheets for the total fair value of financial instruments pledged as collateral for derivatives and repurchase agreements, which is shown parenthetically, and the total cash pledged or received as collateral, which is disclosed as “cash collateral posted to/by counterparties.”
NOTE 5 – DERIVATIVES
Types and Uses of Derivatives Instruments
Interest Rate Derivatives. The Company frequently changes the type of derivative instruments it uses to mitigate the impact of changing interest rates on its repurchase agreement financing costs and the fair value of its investments. Please refer to Note 1 for descriptions of these instruments and how the Company accounts for them.
TBA Transactions. The Company purchases TBA securities as a means of investing in non-specified fixed-rate Agency RMBS and may also periodically sell TBA securities as a means of economically hedging its exposure to Agency RMBS. The Company holds long or short positions in Agency RMBS TBA securities by executing a series of transactions, commonly referred to as “dollar roll” transactions, which effectively delay the settlement of a forward purchase (or sale) of a non-specified Agency RMBS by entering into an offsetting TBA position, net settling the paired-off positions in cash, and simultaneously entering into an identical TBA long (or short) position with a later settlement date. TBA securities purchased (or sold) for a forward settlement date are generally priced at a discount relative to TBA securities settling in the current month. This discount, often referred to as “drop income” represents the economic equivalent of net interest income (interest income less implied financing cost) on the underlying Agency security from trade date to settlement date. The Company accounts for Agency RMBS TBAs (whether net long or net short positions, or collectively “TBA dollar roll positions”) as derivative instruments because it cannot assert that it is probable at inception and throughout the term of an individual TBA transaction that its settlement will result in physical delivery of the underlying Agency RMBS, or that the individual TBA transaction will settle in the shortest period possible.
The table below provides detail of the Company’s gain and losses by type of derivative instrument for the
15
DYNEX CAPITAL, INC.
NOTES TO THE CONSOLIDATED FINANCIAL STATEMENTS
(UNAUDITED)
periods indicated:
| Three Months Ended | Six Months Ended | |||||||||||||||||||||||||
| June 30, | June 30, | |||||||||||||||||||||||||
| Type of Derivative Instrument | 2025 | 2024 | 2025 | 2024 | ||||||||||||||||||||||
($s in thousands) |
||||||||||||||||||||||||||
| U.S. Treasury futures | $ | $ | $ | ( |
$ | |||||||||||||||||||||
Interest rate swaps |
( |
( |
( |
( |
||||||||||||||||||||||
Interest rate swaptions |
||||||||||||||||||||||||||
TBA securities |
( |
( |
||||||||||||||||||||||||
| (Loss) gain on derivative instruments, net | $ | ( |
$ | $ | ( |
$ | ||||||||||||||||||||
The table below provides the carrying amount by type of derivative instrument comprising the Company’s derivative assets and liabilities on its consolidated balance sheets as of the dates indicated:
| Type of Derivative Instrument | Balance Sheet Location | Purpose | June 30, 2025 | December 31, 2024 | ||||||||||||||||||||||
($s in thousands) |
||||||||||||||||||||||||||
Interest rate swaptions |
Derivative assets | Economic hedging | $ | $ | ||||||||||||||||||||||
| TBA securities | Derivative assets | Investing | ||||||||||||||||||||||||
| Total derivatives assets | $ | $ | ||||||||||||||||||||||||
| TBA securities | Derivative liabilities | Investing | $ | $ | ||||||||||||||||||||||
| Total derivatives liabilities | $ | $ | ||||||||||||||||||||||||
The table below presents information regarding the long positions in SOFR-based interest rate swaptions held by the Company as of June 30, 2025, for which the Company had posted $2 million in variation margin. The Company did not hold any interest rate swaptions as of December 31, 2024.
| June 30, 2025 | ||||||||||||||||||||||||||||||||||||||
Option |
Underlying Receiver Swap |
|||||||||||||||||||||||||||||||||||||
Cost Basis |
Fair Value |
Carrying Value |
Notional Amount |
Average Fixed Receive Rate |
Average Term |
|||||||||||||||||||||||||||||||||
($s in thousands) |
||||||||||||||||||||||||||||||||||||||
1-2 year interest rate swaption |
$ | $ | $ | $ | % | |||||||||||||||||||||||||||||||||
Because the daily margin exchanged for the Company’s U.S. Treasury futures and interest rate swaps are considered legal settlement of the derivative as opposed to a pledge of collateral, these instruments have a carrying value of $0 69 ) million as of June 30, 2025 and a net asset position of $1 million as of December 31, 2024, and its interest rate swaps were in a net liability position of $(36 ) million as of June 30, 2025 and net asset position of $153 million as of December 31, 2024. The amount of cash posted by the Company to cover required initial margin for its U.S. Treasury futures and its interest rate swaps was $315 million as of June 30, 2025 and $219 million as of December 31, 2024, which was recorded within “cash collateral posted to counterparties.” The Company had a margin payable of $38 million as of June 30, 2025, which was recorded within “due to counterparties”, and a margin receivable of $10 million as of December 31, 2024, which was recorded within “due from counterparties.”
16
DYNEX CAPITAL, INC.
NOTES TO THE CONSOLIDATED FINANCIAL STATEMENTS
(UNAUDITED)
The table below presents information regarding the short positions in SOFR-based interest rate swaps the Company held as of the dates indicated:
| June 30, 2025 | December 31, 2024 | |||||||||||||||||||||||||
Interest Rate Swaps - Years to Maturity
|
Notional Amount |
Weighted Average Fixed Pay Rate |
Notional Amount |
Weighted Average Fixed Pay Rate |
||||||||||||||||||||||
($s in thousands) |
||||||||||||||||||||||||||
4-5 years fixed pay swap |
$ | ( |
% | $ | ( |
% | ||||||||||||||||||||
5-6 years fixed pay swap |
( |
% | — | — | % | |||||||||||||||||||||
6-7 years fixed pay swap |
( |
% | ( |
% | ||||||||||||||||||||||
9-10 years fixed pay swap |
( |
% | ( |
% | ||||||||||||||||||||||
10-15 years fixed pay swap |
( |
% | — | — | % | |||||||||||||||||||||
| $ | ( |
% | $ | ( |
% | |||||||||||||||||||||
The table below presents information regarding the notional amounts of the short positions in U.S. Treasury futures held by the Company as of the dates indicated:
U.S. Treasury Futures |
June 30, 2025 | December 31, 2024 | ||||||||||||
($s in thousands) |
||||||||||||||
30-year U.S. Treasury futures |
$ | ( |
$ | ( |
||||||||||
10-year U.S. Treasury futures |
( |
( |
||||||||||||
| $ | ( |
$ | ( |
|||||||||||
The following table summarizes information about the notional amounts of the Company's long positions in TBA securities as of the dates indicated:
| TBA securities | June 30, 2025 | December 31, 2024 | ||||||||||||
| ($s in thousands) | ||||||||||||||
Implied market value (1)
|
$ | $ | ||||||||||||
Implied cost basis (2)
|
||||||||||||||
Net carrying value (3)
|
$ | $ | ( |
|||||||||||
(1) Implied market value represents the estimated fair value of the underlying Agency MBS as of the dates indicated .
(2) Implied cost basis represents the forward price to be paid for the underlying Agency MBS as of the dates indicated.
(3) Net carrying value represents the difference between the implied market value and the implied cost basis of the Company’s TBA securities as of the dates indicated. The total shown is the net amount included on the consolidated balance sheets as derivative assets of $30,823 and derivative liabilities of $31 as of June 30, 2025 and $133 and $22,814 , respectively, as of December 31, 2024.
17
DYNEX CAPITAL, INC.
NOTES TO THE CONSOLIDATED FINANCIAL STATEMENTS
(UNAUDITED)
Volume of Activity
The table below summarizes changes in the Company’s derivative instruments for the six months ended June 30, 2025:
| Type of Derivative Instrument | Beginning Notional Amount-Long (Short) |
Additions | Settlements, Terminations, or Pair-Offs |
Ending Notional Amount-Long (Short) |
||||||||||||||||||||||
($s in thousands) |
||||||||||||||||||||||||||
| U.S. Treasury futures | $ | ( |
$ | ( |
$ | $ | ( |
|||||||||||||||||||
Interest rate swaps |
( |
( |
— | ( |
||||||||||||||||||||||
Interest rate swaptions |
— | |||||||||||||||||||||||||
| TBA securities | ( |
|||||||||||||||||||||||||
Offsetting
The Company's derivatives are subject to underlying agreements with master netting or similar arrangements, which provide for the right of set off in the event of default or in the event of bankruptcy of either party to the transactions. The Company reports its derivative assets and liabilities subject to these arrangements on a gross basis. Please see Note 4 for information related to the Company’s repurchase agreements, which are also subject to underlying agreements with master netting or similar arrangements. The following tables present information regarding those derivative assets and liabilities subject to such arrangements as if the Company had presented them on a net basis as of June 30, 2025 and December 31, 2024:
| Offsetting of Assets | |||||||||||||||||||||||||||||||||||
($s in thousands) |
Gross Amount of Recognized Assets | Gross Amount Offset in the Balance Sheet | Net Amount of Assets Presented in the Balance Sheet |
Gross Amount Not Offset in the Balance Sheet (1)
|
Net Amount | ||||||||||||||||||||||||||||||
| Financial Instruments Received as Collateral | Cash Received as Collateral | ||||||||||||||||||||||||||||||||||
| June 30, 2025 | |||||||||||||||||||||||||||||||||||
Interest rate swaptions |
$ | $ | $ | $ | $ | $ | |||||||||||||||||||||||||||||
| TBA securities | ( |
( |
|||||||||||||||||||||||||||||||||
| Derivative assets | $ | $ | $ | $ | ( |
$ | ( |
$ | |||||||||||||||||||||||||||
| December 31, 2024 | |||||||||||||||||||||||||||||||||||
| TBA securities | $ | $ | $ | $ | ( |
$ | $ | ||||||||||||||||||||||||||||
| Derivative assets | $ | $ | $ | $ | ( |
$ | $ | ||||||||||||||||||||||||||||
18
DYNEX CAPITAL, INC.
NOTES TO THE CONSOLIDATED FINANCIAL STATEMENTS
(UNAUDITED)
| Offsetting of Liabilities | |||||||||||||||||||||||||||||||||||
($s in thousands) |
Gross Amount of Recognized Liabilities | Gross Amount Offset in the Balance Sheet | Net Amount of Liabilities Presented in the Balance Sheet |
Gross Amount Not Offset in the Balance Sheet (1)
|
Net Amount | ||||||||||||||||||||||||||||||
| Financial Instruments Posted as Collateral | Cash Posted as Collateral | ||||||||||||||||||||||||||||||||||
| June 30, 2025 | |||||||||||||||||||||||||||||||||||
| TBA securities | $ | $ | $ | $ | ( |
$ | $ | ||||||||||||||||||||||||||||
| Derivative liabilities | $ | $ | $ | $ | ( |
$ | $ | ||||||||||||||||||||||||||||
| December 31, 2024 | |||||||||||||||||||||||||||||||||||
| TBA securities | $ | $ | $ | $ | ( |
$ | ( |
$ | |||||||||||||||||||||||||||
| Derivative liabilities | $ | $ | $ | $ | ( |
$ | ( |
$ | |||||||||||||||||||||||||||
(1) Amounts disclosed for collateral received by or posted to the same counterparty include cash and the fair value of MBS up to and not exceeding the net amount of the derivative asset or liability presented in the balance sheet. The fair value of the total collateral received by or posted to the same counterparty may exceed the amounts presented. Please refer to the consolidated balance sheets for the total fair value of financial instruments pledged as collateral for derivatives and repurchase agreements, which is shown parenthetically, and the total cash pledged or received as collateral which is disclosed as “cash collateral posted to/by counterparties.”
NOTE 6 – FAIR VALUE OF FINANCIAL INSTRUMENTS
Fair value is defined as the price that would be received to sell an asset or paid to transfer a liability in an orderly transaction between market participants at the measurement date. Fair value is based on the assumptions market participants would use when pricing an asset or liability and also considers all aspects of nonperformance risk, including the entity’s own credit standing, when measuring fair value of a liability. ASC Topic 820 established a valuation hierarchy of three levels as follows:
•Level 1 – Inputs are unadjusted, quoted prices in active markets for identical assets or liabilities as of the measurement date.
•Level 2 – Inputs include quoted prices in active markets for similar assets or liabilities; quoted prices in inactive markets for identical or similar assets or liabilities; or inputs either directly observable or indirectly observable through correlation with market data at the measurement date and for the duration of the instrument’s anticipated life.
•Level 3 – Unobservable inputs are supported by little or no market activity. The unobservable inputs represent management’s best estimate of how market participants would price the asset or liability at the measurement date. Consideration is given to the risk inherent in the valuation technique and the risk inherent in the inputs to the model.
The following table presents the Company’s financial instruments that are measured at fair value on the Company’s consolidated balance sheet by their valuation hierarchy levels as of the dates indicated:
19
DYNEX CAPITAL, INC.
NOTES TO THE CONSOLIDATED FINANCIAL STATEMENTS
(UNAUDITED)
($s in thousands) |
June 30, 2025 | December 31, 2024 | |||||||||||||||||||||||||||||||||||||||||||||
Total |
Level 1 | Level 2 | Level 3 | Total |
Level 1 | Level 2 | Level 3 | ||||||||||||||||||||||||||||||||||||||||
Assets: |
|||||||||||||||||||||||||||||||||||||||||||||||
| MBS | $ | $ | $ | $ | $ | $ | $ | $ | |||||||||||||||||||||||||||||||||||||||
TBA securities (1)
|
|||||||||||||||||||||||||||||||||||||||||||||||
Interest rate swaptions |
|||||||||||||||||||||||||||||||||||||||||||||||
Mortgage loans (2)
|
|||||||||||||||||||||||||||||||||||||||||||||||
Total assets carried at fair value |
$ | $ | $ | $ | $ | $ | $ | $ | |||||||||||||||||||||||||||||||||||||||
Liabilities: |
|||||||||||||||||||||||||||||||||||||||||||||||
TBA securities (1)
|
$ | $ | $ | $ | $ | $ | $ | $ | |||||||||||||||||||||||||||||||||||||||
Total liabilities carried at fair value |
$ | $ | $ | $ | $ | $ | $ | $ | |||||||||||||||||||||||||||||||||||||||
(1)TBA securities are reflected on consolidated balance sheets within “derivative assets” and “derivative liabilities” at their implied fair value, net of implied cost basis. Please refer to Note 5 for additional information.
As of June 30, 2025, the fair value measurements for the Company’s TBA securities and its MBS are considered Level 2 because there are substantially similar securities actively trading or for which there has been recent trading activity in their respective markets. Fair value for Agency MBS and Agency RMBS TBA securities is based on prices received from an independent third-party pricing service. In valuing a security, the pricing service primarily uses a market approach, which uses observable prices and other relevant information that is generated by market transactions of identical or similar securities, but may use an income approach, which uses valuation techniques such as discounted cash flow modeling. Examples of the observable inputs and assumptions used in the valuation techniques include market interest rates, credit spreads, and projected prepayment speeds, among other things. The Company reviews the prices it receives from the pricing service for reasonableness using broker quotes as well as other third-party pricing services.
As of June 30, 2025, the Company's mortgage loans held for investment are single-family mortgage loans, which were originated or purchased by the Company prior to 2000, and for which the Company has elected the fair value option. The fair value measurements for these mortgage loans are considered Level 3 because there has been no recent trading activity of similar instruments upon which their fair value can be measured. The fair value for these Level 3 assets is measured by discounting the estimated future cash flows derived from cash flow models using certain inputs such as the security’s credit rating, coupon rate, estimated prepayment speeds, expected weighted average life, collateral composition, and expected credit losses as well as certain other relevant information. The Company used a constant prepayment rate assumption of 10 2 20 10
The Company’s short positions in U.S. Treasury futures contracts are valued based on exchange pricing and are classified accordingly as Level 1 measurements. Interest rate swaps are valued using the daily settlement price, or fair value, determined by the clearing exchange based on a pricing model that references observable market inputs, including current benchmark rates and the forward yield curve, and thus their fair values are considered Level 2 measurements. The carrying value of the U.S. Treasury futures contracts and interest rate swaps on the Company’s consolidated balance sheets is $0
20
DYNEX CAPITAL, INC.
NOTES TO THE CONSOLIDATED FINANCIAL STATEMENTS
(UNAUDITED)
considered by the settlement agent to represent legal settlement of the contracts on a daily basis. Please see Note 1 and Note 5 for additional information regarding the fair value of the Company’s derivative instruments.
The fair value of interest rate swaptions is considered Level 2 because it is based on the fair value of the underlying interest rate swap and time remaining until its expiration and is carried on the balance sheet net of any deferred premium to be paid upon expiration or sale.
NOTE 7 – SHAREHOLDERS’ EQUITY AND SHARE-BASED COMPENSATION
Preferred Stock. The Company’s Board of Directors has designated 6,600,000 shares of the Company’s preferred stock for issuance as Series C Preferred Stock, of which the Company has 4,460,000 of such shares outstanding as of June 30, 2025. The Series C Preferred Stock has no stated maturity, is not subject to any sinking fund or mandatory redemption, and will remain outstanding indefinitely unless redeemed, repurchased, or converted into common stock pursuant to the terms of the Series C Preferred Stock. As of April 15, 2025, the Series C Preferred Stock may be redeemed at any time and from time to time at the Company's option at a cash redemption price of $25.00 per share plus any accumulated and unpaid dividends. In addition, the Series C Preferred Stock will now pay a quarterly cumulative cash dividend at a percentage of its $25.00 liquidation value per share equal to 3-month term SOFR plus the statutorily prescribed tenor spread adjustment of 0.26161 % in addition to the spread pursuant to the terms of the Series C Preferred Stock of 5.461 % for a total spread of 5.723 %. The Company paid a quarterly dividend of $0.62395 per share of Series C Preferred Stock on July 15, 2025 to shareholders of record as of July 1, 2025.
Common Stock. During the six months ended June 30, 2025, the Company issued 40,712,768 shares of its common stock through its at-the-market (“ATM”) program at an aggregate value of $522 million, net of broker commissions and fees. The Company declared monthly dividends on its common stock totaling $0.51 for the three months ended June 30, 2025. The Company’s timing, frequency, and amount of dividends declared on its common stock are determined by its Board of Directors. When declaring dividends, the Board of Directors considers the Company’s taxable income, management’s view on long-term returns, the REIT distribution requirements of the Tax Code, and maintaining compliance with dividend requirements of the Series C Preferred Stock, along with other factors that the Board of Directors may deem relevant from time to time.
21
DYNEX CAPITAL, INC.
NOTES TO THE CONSOLIDATED FINANCIAL STATEMENTS
(UNAUDITED)
Share-Based Compensation. The following table presents a rollforward of share-based awards for the periods indicated:
| Six Months Ended | ||||||||||||||||||||||||||
| June 30, | ||||||||||||||||||||||||||
| 2025 | 2024 | |||||||||||||||||||||||||
| Type of Award | Shares |
Weighted Average
Grant Date
Fair Value
Per Share
|
Shares |
Weighted Average
Grant Date
Fair Value
Per Share
|
||||||||||||||||||||||
| Restricted stock: | ||||||||||||||||||||||||||
| Awards outstanding, beginning of period | $ | $ | ||||||||||||||||||||||||
| Granted | ||||||||||||||||||||||||||
| Vested | ( |
( |
||||||||||||||||||||||||
| Awards outstanding, end of period | $ | $ | ||||||||||||||||||||||||
Target RSUs: (1)
|
||||||||||||||||||||||||||
| Awards outstanding, beginning of period | $ | $ | ||||||||||||||||||||||||
| Granted | ||||||||||||||||||||||||||
| Vested | ( |
( |
||||||||||||||||||||||||
| Awards outstanding, end of period | $ | $ | ||||||||||||||||||||||||
Target PSUs: (2)
|
||||||||||||||||||||||||||
| Awards outstanding, beginning of period | $ | $ | ||||||||||||||||||||||||
| Granted | ||||||||||||||||||||||||||
| Vested | ||||||||||||||||||||||||||
| Awards outstanding, end of period | $ | $ | ||||||||||||||||||||||||
(1)The number of RSUs shown represent the target number of awards. Actual number of shares that will potentially settle may range from 0 % if the recipient’s service-based vesting condition is not met to 100 % if the service-based vesting condition is met.
(2)The number of PSUs shown represent the target number of awards. Actual number of shares that will potentially settle may range from 0 % to 200 % based on the achievement of the performance goals defined in each grant award.
The restricted stock awards that vested during the six months ended June 30, 2025 were all granted to employees except for 38,068 granted to the Company’s non-employee members of its Board of Directors. Restricted stock granted to employees generally vests in equal installments over a period of 3 years.
RSUs vest in equal installments over a period of 3 years. PSUs cliff vest based on performance results measured over a period of 3 years. The Company expects 101 % of the remaining target PSUs outstanding as of June 30, 2025 will be settled on their vesting dates.
The Company has DERs accrued for RSUs and PSUs of $1 1
Total share-based compensation expense recognized by the Company for the three and six months ended June 30, 2025 was $3 million and $6 million compared to $1 million and $5 million for the three and six months
22
DYNEX CAPITAL, INC.
NOTES TO THE CONSOLIDATED FINANCIAL STATEMENTS
(UNAUDITED)
ended June 30, 2024. The following table discloses the Company’s remaining compensation expense related to stock awards it has granted as of June 30, 2025, which will be amortized over the period disclosed:
| June 30, 2025 | |||||||||||
($s in thousands) |
Remaining Compensation Cost | WAVG Period of Recognition | |||||||||
| Restricted stock | $ | ||||||||||
| RSUs | |||||||||||
| PSUs | |||||||||||
| Total | $ | ||||||||||
NOTE 8 - SEGMENT REPORTING
The Company’s operations consist of one reportable segment which involves investing in MBS and funding these investments with repurchase agreements and equity. Because the Company’s investment portfolio and financings are subject to market risks, primarily interest rate risk, management seeks to offset a portion of its market value exposure and financing costs through its interest rate derivative instruments (“hedging portfolio”). The Company’s investment and hedging portfolios are managed together.
23
ITEM 2. MANAGEMENT’S DISCUSSION AND ANALYSIS OF FINANCIAL CONDITION AND RESULTS OF OPERATIONS
EXECUTIVE OVERVIEW
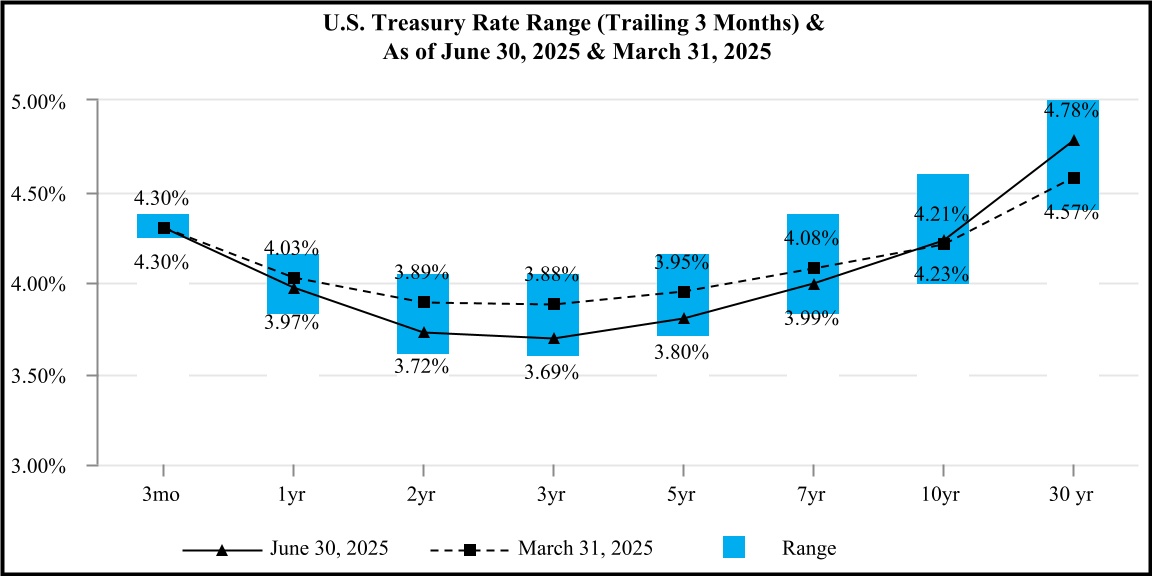
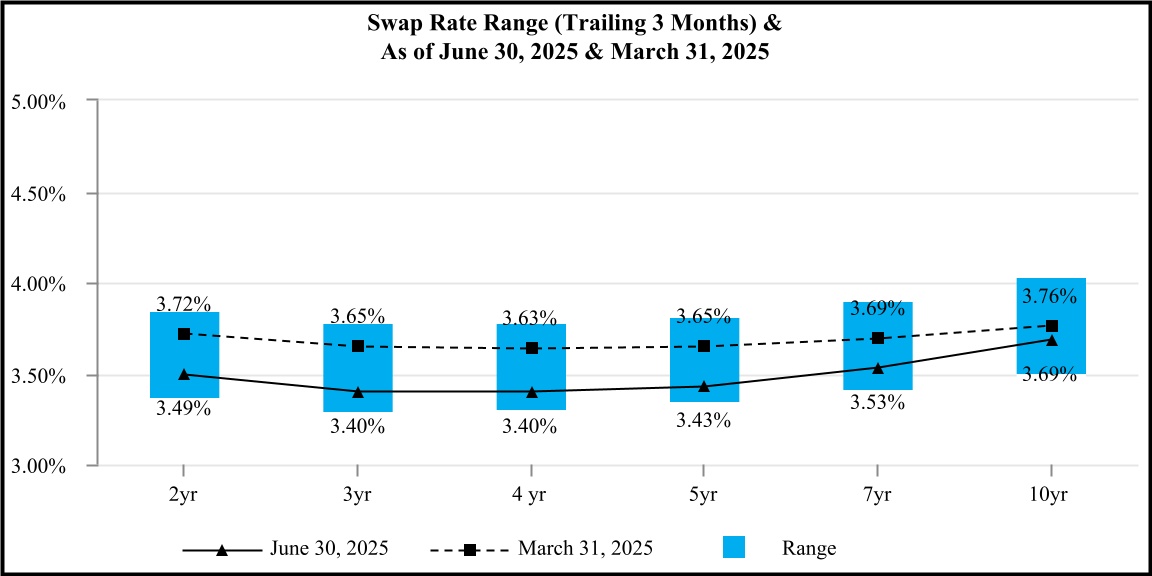
From year end 2024 to June 30, 2025, interest rates across the U.S. Treasury curve were mostly lower, and from March 31, 2025 to June 30, 2025, the U.S. 10-year U.S. Treasury rate and U.S. Federal Funds rate were essentially flat, but spreads were slightly wider. In addition, swap spreads have broadly trended more negative during the year which have had an impact on existing swaps, but improve the carry of additional swaps added to the portfolio. Dynex continues to be active in the ATM program, raising approximately $522 million of new capital during the six months ended June 30, 2025, which has been deployed into the Agency market at historically attractive levels and also provides liquidity. For Dynex, net interest income and spread income continue to improve from adding higher yielding assets to the portfolio, reducing financing costs and adding to yield from our swap portfolio. The news cycle this quarter has been active with new proposed U.S. policies, tariff negotiations and conflicts around the globe. We continue to operate our business at the intersection of the global capital markets and the U.S. housing finance system and take seriously our responsibility of being stewards of shareholder capital. The Dynex team remains focused on managing risk and investing to deliver compelling shareholder returns over time.
Market Data
The charts below show the range of U.S. Treasury and SOFR-based swap rates for the second quarter of 2025 and information regarding market spreads as of and for the periods indicated:
24
Market Spreads as of:
|
Change in Spreads YTD |
|||||||||||||||||||||||||
Investment Type: (1)
|
June 30, 2025 | March 31, 2025 | December 31, 2024 | |||||||||||||||||||||||
Agency RMBS: |
||||||||||||||||||||||||||
| 2.0% coupon | 96 | 85 | 89 | 7 | ||||||||||||||||||||||
| 2.5% coupon | 99 | 90 | 93 | 6 | ||||||||||||||||||||||
| 4.0% coupon | 78 | 65 | 69 | 9 | ||||||||||||||||||||||
| 4.5% coupon | 76 | 65 | 68 | 8 | ||||||||||||||||||||||
| 5.0% coupon | 77 | 66 | 69 | 8 | ||||||||||||||||||||||
| 5.5% coupon | 82 | 69 | 72 | 10 | ||||||||||||||||||||||
| 6.0% coupon | 86 | 66 | 74 | 12 | ||||||||||||||||||||||
Agency DUS (Agency CMBS)(2)
|
102 | 94 | 96 | 6 | ||||||||||||||||||||||
Freddie K AAA IO (Agency CMBS IO)(2)
|
115 | 130 | 120 | (5) | ||||||||||||||||||||||
(1)Option adjusted spreads (“OAS”) are based on Company estimates using third-party models and market data. OAS shown for prior periods may differ from previous disclosures because the Company regularly updates the third-party model used.
(2)Data represents the spread to swap rate on newly issued securities and is sourced from J.P. Morgan.
25
The following table summarizes the changes in the Company's financial position during the second quarter of 2025:
($s in thousands except per share data) |
Net Change in Fair Value | Components of Comprehensive Income |
Common Book Value Rollforward | Per Common Share |
|||||||||||||||||||
Balance as of March 31, 2025 (1)
|
$ | 1,284,415 | $ | 12.56 | |||||||||||||||||||
Net interest income |
$ | 23,128 | |||||||||||||||||||||
Periodic interest from interest rate swaps |
12,349 | ||||||||||||||||||||||
| G & A and other operating expenses | (12,293) | ||||||||||||||||||||||
| Preferred stock dividends | (2,680) | ||||||||||||||||||||||
| Changes in fair value: | |||||||||||||||||||||||
| MBS and loans | $ | 37,716 | |||||||||||||||||||||
| TBAs | 7,608 | ||||||||||||||||||||||
| U.S. Treasury futures | 6,320 | ||||||||||||||||||||||
Interest rate swaps |
(84,552) | ||||||||||||||||||||||
Interest rate swaptions |
182 | ||||||||||||||||||||||
| Total net change in fair value | (32,726) | ||||||||||||||||||||||
Comprehensive loss to common shareholders |
(12,222) | ||||||||||||||||||||||
| Capital transactions: | |||||||||||||||||||||||
Net proceeds from stock issuance (2)
|
285,593 | ||||||||||||||||||||||
| Common dividends declared | (59,293) | ||||||||||||||||||||||
Balance as of June 30, 2025 (1)
|
$ | 1,498,493 | $ | 11.95 | |||||||||||||||||||
(1)Amounts represent total shareholders' equity less the aggregate liquidation preference of the Company's preferred stock of $111.5 million, in thousands and on a per common share basis.
(2)Net proceeds from common stock issuance include approximately $282.1 million from ATM issuances and approximately $3.5 million from amortization of share-based compensation, net of grants, during the three months ended June 30, 2025.
Current Outlook
Markets continue to experience volatility in response to policy changes and a fast moving news cycle. We expect volatility to continue and remain focused on maintaining a portfolio of high-quality liquid securities and maintaining liquidity. While Agency and swaps markets have re-priced, the current market environment is not directly impacted by a specific real estate or mortgage event. We are also focused on our hedging strategy and believe options will be part of our hedge portfolio going forward. We also continue to monitor the prepayment risk of our portfolio, the direction of rates, and the outlook for U.S. Federal Reserve policy. The mortgage finance sector continues to evolve and will leverage new technologies that are likely to expedite refinancing which may result in an increase in prepayment risk.
Some certainty on the implicit guarantee on Agency securities was provided this quarter, but the future structure of the GSEs remains uncertain, and we continue to be engaged with policymakers to monitor these developments. We continue to monitor global macroeconomic conditions and large investment flows.
As of the end of the second quarter 2025, we expect to continue a strategy of raising capital and deploying into highly liquid markets with little or no credit risk that is providing compelling returns that are supportive of our dividend now and into the future.
26
FINANCIAL CONDITION
Investment Portfolio
Our investment portfolio (including TBAs) as of June 30, 2025, has increased approximately 44% compared to December 31, 2024. The following charts compare the composition of our MBS portfolio (including TBAs) as of the dates indicated:
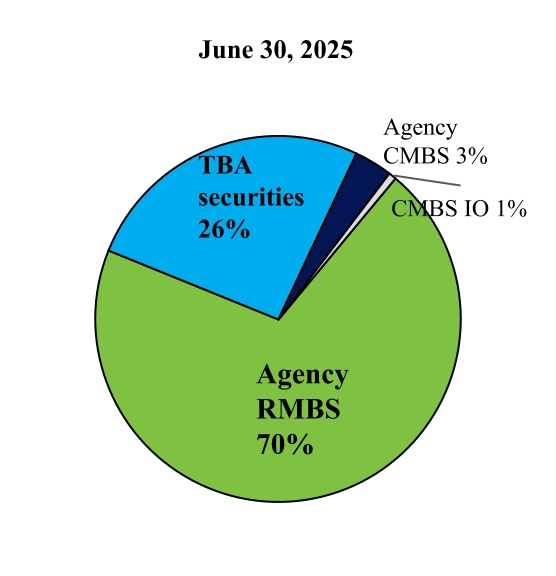
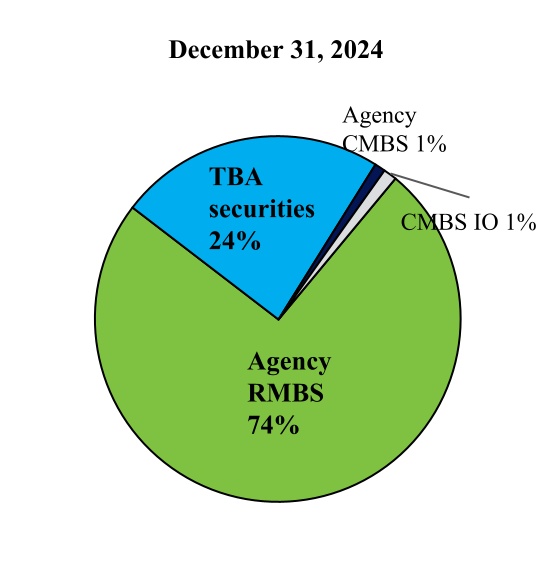
We have added approximately $2.8 billion of Agency RMBS and $418 million of Agency CMBS during the six months ended June 30, 2025, of which $937 million were pending settlement as of June 30, 2025. We also increased our TBA dollar roll positions by a notional of $1.4 billion during the six months ended June 30, 2025. The Agency CMBS purchases have a different convexity profile compared to our Agency RMBS, which we believe adds diversification to our investment portfolio.
The following tables compare our fixed-rate Agency RMBS investments, including TBA dollar roll positions, as of the dates indicated:
| June 30, 2025 | ||||||||||||||||||||||||||||||||||||||||||||
Agency RMBS by Coupon |
Par/Notional |
Amortized Cost/
Implied Cost
Basis (2)(4)
|
Fair
Value (3)(4)
|
Weighted Average | ||||||||||||||||||||||||||||||||||||||||
|
Loan Age
(in months)(5)
|
3 Month
CPR (5)(6)
|
Estimated Duration (7)
|
Market Yield (8)
|
|||||||||||||||||||||||||||||||||||||||||
| ($s in thousands) | ||||||||||||||||||||||||||||||||||||||||||||
| 2.0% | $ | 629,325 | $ | 639,437 | $ | 506,027 | 57 | 6.1 | % | 7.42 | 4.93 | % | ||||||||||||||||||||||||||||||||
| 2.5% | 541,015 | 561,012 | 455,838 | 58 | 5.3 | % | 7.05 | 4.93 | % | |||||||||||||||||||||||||||||||||||
| 4.0% | 309,051 | 309,469 | 291,063 | 51 | 8.4 | % | 6.05 | 4.96 | % | |||||||||||||||||||||||||||||||||||
| 4.5% | 1,823,473 | 1,766,385 | 1,755,138 | 29 | 7.3 | % | 5.67 | 5.10 | % | |||||||||||||||||||||||||||||||||||
| 5.0% | 2,868,556 | 2,814,838 | 2,831,069 | 21 | 7.8 | % | 5.03 | 5.20 | % | |||||||||||||||||||||||||||||||||||
| 5.5% | 3,779,307 | 3,787,911 | 3,801,864 | 13 | 6.3 | % | 4.16 | 5.40 | % | |||||||||||||||||||||||||||||||||||
| 6.0% | 288,534 | 292,046 | 295,837 | 19 | 8.9 | % | 3.05 | 5.50 | % | |||||||||||||||||||||||||||||||||||
| TBA 4.0% | 1,282,000 | 1,178,398 | 1,192,572 | n/a | n/a | 6.48 | 5.03 | % | ||||||||||||||||||||||||||||||||||||
TBA 4.5% (1)
|
870,000 | 849,450 | 858,382 | n/a | n/a | 3.89 | 4.71 | % | ||||||||||||||||||||||||||||||||||||
| TBA 5.0% | 922,000 | 900,205 | 903,920 | n/a | n/a | 5.25 | 5.27 | % | ||||||||||||||||||||||||||||||||||||
| TBA 5.5% | 728,000 | 723,974 | 727,943 | n/a | n/a | 4.03 | 5.51 | % | ||||||||||||||||||||||||||||||||||||
| Total | $ | 14,041,261 | $ | 13,823,125 | $ | 13,619,653 | 24 | 7.0 | % | 5.02 | 5.20 | % | ||||||||||||||||||||||||||||||||
| December 31, 2024 | ||||||||||||||||||||||||||||||||||||||||||||
Agency RMBS by Coupon |
Par/Notional |
Amortized Cost/
Implied Cost
Basis (2)(4)
|
Fair
Value (3)(4)
|
Weighted Average | ||||||||||||||||||||||||||||||||||||||||
|
Loan Age
(in months)(5)
|
3 Month
CPR (5)(6)
|
Estimated Duration (7)
|
Market Yield (8)
|
|||||||||||||||||||||||||||||||||||||||||
| ($s in thousands) | ||||||||||||||||||||||||||||||||||||||||||||
| 2.0% | $ | 655,356 | $ | 666,107 | $ | 516,541 | 51 | 5.0 | % | 6.49 | 5.42 | % | ||||||||||||||||||||||||||||||||
| 2.5% | 561,625 | 582,776 | 463,402 | 52 | 4.3 | % | 6.37 | 5.33 | % | |||||||||||||||||||||||||||||||||||
| 4.0% | 324,615 | 325,091 | 299,774 | 45 | 6.4 | % | 5.92 | 5.25 | % | |||||||||||||||||||||||||||||||||||
| 4.5% | 1,323,371 | 1,291,410 | 1,252,219 | 27 | 7.4 | % | 5.79 | 5.33 | % | |||||||||||||||||||||||||||||||||||
| 5.0% | 2,356,262 | 2,315,518 | 2,284,613 | 18 | 5.7 | % | 5.19 | 5.47 | % | |||||||||||||||||||||||||||||||||||
| 5.5% | 2,193,064 | 2,207,296 | 2,178,180 | 13 | 5.3 | % | 4.53 | 5.61 | % | |||||||||||||||||||||||||||||||||||
| 6.0% | 303,470 | 307,211 | 307,509 | 13 | 13.2 | % | 3.60 | 5.74 | % | |||||||||||||||||||||||||||||||||||
| TBA 4.0% | 462,000 | 424,917 | 421,796 | n/a | n/a | 6.62 | 5.20 | % | ||||||||||||||||||||||||||||||||||||
| TBA 4.5% | 383,000 | 361,610 | 359,837 | n/a | n/a | 5.95 | 5.35 | % | ||||||||||||||||||||||||||||||||||||
| TBA 5.0% | 710,000 | 693,938 | 684,706 | n/a | n/a | 5.20 | 5.51 | % | ||||||||||||||||||||||||||||||||||||
| TBA 5.5% | 864,000 | 860,609 | 852,053 | n/a | n/a | 4.21 | 5.73 | % | ||||||||||||||||||||||||||||||||||||
| Total | $ | 10,136,763 | $ | 10,036,483 | $ | 9,620,630 | 23 | 6.1 | % | 5.22 | 5.49 | % | ||||||||||||||||||||||||||||||||
(1)Includes $700 million notional amount of 15-year TBA securities with an implied cost basis of $689 million.
(2)Implied cost basis of TBAs represents the forward price to be paid for the underlying Agency MBS.
(3)Fair value of TBAs is the implied market value of the underlying Agency security as of the end of the period.
(4)TBAs are included on the consolidated balance sheet within “derivative assets/liabilities” at their net carrying value which is the difference between their implied market value and implied cost basis. Please refer to Note 5 of the Notes to the Consolidated Financial Statements for additional information.
(5)TBAs are excluded from this calculation as they do not have a defined weighted-average loan balance or age until mortgages have been assigned to the pool.
(6)Constant prepayment rate (“CPR”) represents the 3-month CPR of Agency RMBS held as of date indicated.
(7)Duration measures the sensitivity of a security's price to the change in interest rates and represents the percent change in price of a security for a 100-basis point increase in interest rates. We calculate duration using third-party financial models and empirical data. Different models and methodologies can produce different estimates of duration for the same securities.
(8)Represents the weighted average market yield projected using cash flows generated from the forward curve based on market prices as of the date indicated and assuming zero volatility.
Our Agency CMBS consist of loans collateralized by multifamily properties. Though we expect our exposure to Agency CMBS to remain modest as a percentage of the total portfolio, we added selectively in the second quarter of 2025 where the risk-adjusted return profile aligned with our broader strategy. In addition to offering compelling relative value, Agency CMBS help diversify and stabilize the portfolio's cash flow and total return profile, given their unique prepayment characteristics and underlying asset base.
Agency CMBS IO are backed by loans collateralized by multifamily properties, which have performed well given the demand for housing in the United States. Our Agency CMBS IO are from Freddie Mac Series K deals from which interest continues to be advanced even in the event of an underlying default up until liquidation. According to Freddie Mac, 99.6% of the loans in K-deals are current as of May 2025. Our non-Agency CMBS IO were all originated prior to 2018 and are backed by loans collateralized by a number of different property types, such as multifamily, office, retail, hotels, industrial, storage, and others. Our non-Agency CMBS IO investments are nearing maturity and have very little amortized cost remaining; any changes in actual payments may result in large swings in yield as shown below.
The following table provides certain information regarding our CMBS and CMBS IO as of the dates indicated:
| June 30, 2025 | |||||||||||||||||||||||||||||
($s in thousands) |
Par/Notional Value |
Amortized Cost | Fair Value |
WAVG Life Remaining (1)
|
WAVG Market Yield (2)
|
||||||||||||||||||||||||
| Agency CMBS | $ | 470,444 | $ | 470,882 | $ | 472,426 | 5.6 | 4.40 | % | ||||||||||||||||||||
CMBS IO |
6,803,825 | 101,670 | 100,746 | 4.5 | 12.66 | % | |||||||||||||||||||||||
| Total | $ | 572,552 | $ | 573,172 | |||||||||||||||||||||||||
| December 31, 2024 | |||||||||||||||||||||||||||||
($s in thousands) |
Par/Notional Value |
Amortized Cost | Fair Value |
WAVG Life Remaining (1)
|
WAVG Market Yield (2)
|
||||||||||||||||||||||||
| Agency CMBS | $ | 99,636 | $ | 99,848 | $ | 95,463 | 2.6 | 4.76 | % | ||||||||||||||||||||
CMBS IO |
8,647,176 | 117,591 | 114,386 | 4.5 | 12.65 | % | |||||||||||||||||||||||
| Total | $ | 217,439 | $ | 209,849 | |||||||||||||||||||||||||
(1) Represents the weighted average life remaining in years based on contractual cash flows as of the dates indicated. | |||||||||||||||||||||||||||||
(2) Represents the weighted average market yield projected using cash flows generated off the forward curve based on market prices as of the dates indicated and assuming zero volatility. | |||||||||||||||||||||||||||||
Repurchase Agreements
Our repurchase agreement borrowings increased to $9 billion as of June 30, 2025 from $7 billion as of December 31, 2024 as we used these funds to partially finance our purchases of Agency MBS during the six months ended June 30, 2025. We have not experienced any difficulty in securing financing with any of our counterparties, and our repurchase agreement counterparties have not indicated any concerns regarding leverage or credit. Please refer to Note 4 of the Notes to the Consolidated Financial Statements contained within this Quarterly Report on Form 10-Q as well as “Results of Operations” and “Liquidity and Capital Resources” contained within this Item 2 for additional information relating to our repurchase agreement borrowings.
Derivative Assets and Liabilities
Please refer to Note 5 of the Notes to the Consolidated Financial Statements for details on our interest rate hedging instruments as well as “Liquidity and Capital Resources” within Item 2 and “Quantitative and Qualitative Disclosures about Market Risk” in Item 3 of this Quarterly Report on Form 10-Q.
RESULTS OF OPERATIONS
Three Months Ended June 30, 2025 Compared to the Three Months Ended March 31, 2025
The following table summarizes the results of operations for the periods discussed in this section:
| Three Months Ended | |||||||||||
| $s in thousands | June 30, 2025 | March 31, 2025 | |||||||||
Net interest income |
$ | 23,128 | $ | 17,133 | |||||||
Unrealized gain on investments, net |
33,652 | 109,997 | |||||||||
Loss on derivative instruments, net |
(58,093) | (118,088) | |||||||||
Operating expenses, net |
(12,293) | (12,118) | |||||||||
| Preferred stock dividends | (2,680) | (1,923) | |||||||||
Net loss to common shareholders |
(16,286) | (4,999) | |||||||||
Other comprehensive income |
4,064 | 19,390 | |||||||||
Comprehensive (loss) income to common shareholders |
$ | (12,222) | $ | 14,391 | |||||||
Net Interest Income
Net interest income and net interest spread improved for the three months ended June 30, 2025, compared to the three months ended March 31, 2025 due to a larger portfolio of Agency RMBS with higher yields. Financing costs also declined approximately 11 basis points for the three months ended June 30, 2025, compared to the three months ended March 31, 2025.
The following table presents information about our interest-earning assets and interest-bearing liabilities and their performance for the periods indicated:
| Three Months Ended | |||||||||||||||||||||||||||||||||||
| June 30, 2025 | March 31, 2025 | ||||||||||||||||||||||||||||||||||
| ($s in thousands) | Interest Income/Expense |
Average Balance (1)(2)
|
Effective Yield/
Financing Cost (3)(4)
|
Interest Income/Expense |
Average Balance (1)(2)
|
Effective Yield/
Financing Cost (3)(4)
|
|||||||||||||||||||||||||||||
| Agency RMBS | $ | 102,738 | $ | 8,663,590 | 4.74 | % | $ | 90,075 | $ | 7,726,081 | 4.66 | % | |||||||||||||||||||||||
| Agency CMBS | 1,945 | 189,815 | 4.05 | % | 735 | 86,880 | 3.38 | % | |||||||||||||||||||||||||||
CMBS IO (5)
|
2,612 | 105,162 | 9.62 | % | 2,332 | 113,263 | 8.74 | % | |||||||||||||||||||||||||||
Mortgage loans |
12 | 940 | 4.40 | % | 14 | 999 | 4.96 | % | |||||||||||||||||||||||||||
| MBS and loans | 107,307 | $ | 8,959,507 | 4.79 | % | 93,156 | 7,927,223 | 4.71 | % | ||||||||||||||||||||||||||
| Cash equivalents | 4,439 | 1,903 | |||||||||||||||||||||||||||||||||
| Total interest income | $ | 111,746 | $ | 95,059 | |||||||||||||||||||||||||||||||
| Repurchase agreement financing | (88,618) | 7,871,627 | (4.45) | % | (77,926) | 6,842,485 | (4.56) | % | |||||||||||||||||||||||||||
Net interest income/spread |
$ | 23,128 | 0.33 | % | $ | 17,133 | 0.15 | % | |||||||||||||||||||||||||||
Net periodic interest (6)
|
12,349 | 0.63 | % | 10,851 | 0.64 | % | |||||||||||||||||||||||||||||
Economic net interest income/spread (6)
|
$ | 35,477 | 0.96 | % | $ | 27,984 | 0.79 | % | |||||||||||||||||||||||||||
*Table Note: Data may not foot due to rounding. | |||||||||||||||||||||||||||||||||||
(1)Average balance for assets is calculated as a simple average of the daily amortized cost and excludes securities pending settlement if applicable.
(2)Average balance for liabilities is calculated as a simple average of the daily borrowings outstanding during the period.
(3)Effective yield is calculated by dividing annualized interest income by the average balance of asset type outstanding during the reporting period. Unscheduled adjustments to premium/discount amortization/accretion, such as for prepayment compensation, are not annualized in this calculation.
(4)Financing cost is calculated by dividing annualized interest expense by the total average balance of borrowings outstanding during the period with an assumption of 360 days in a year.
(5)Includes Agency and non-Agency issued securities.
(6)Net periodic interest is the difference between the fixed interest rate we pay and the variable interest rate we receive on our interest rate swaps. It is a component of economic net interest income (expense), a non-GAAP measure. Please refer to the section below “Non-GAAP Financial Measures” for more information.
The following table presents information regarding the performance of our TBA dollar roll transactions for the periods indicated:
| Three Months Ended | ||||||||||||||||||||||||||||||||||||||
| June 30, 2025 | March 31, 2025 | |||||||||||||||||||||||||||||||||||||
| ($s in thousands) |
Implied Net Interest Income (1)
|
Average Balance |
Implied Net Spread |
Implied Net Interest Income (1)
|
Average Balance | Implied Net Spread | ||||||||||||||||||||||||||||||||
TBAs |
$ | 4,758 | $ | 2,425,857 | 0.78 | % | $ | 4,785 | $ | 2,400,084 | 0.80 | % | ||||||||||||||||||||||||||
(1)Implied net interest income (expense) is also referred to as “drop income (loss)” and represents a portion of the total realized gain (loss) from our TBA dollar roll transactions recorded within “gain (loss) on derivative instruments, net.”
Gains (Losses) on Investments and Derivative Instruments
During the three months ended June 30, 2025, the fair value of our investment portfolio increased $45 million primarily due to recent purchases of new investments when spreads widened. These gains were offset by net losses on our hedging portfolio of $(78) million (excluding $12 million of net periodic interest we earned from our interest rate swaps), primarily as a result of the decline in SOFR-based swap rates and U.S. Treasury rates as of June 30, 2025 versus March 31, 2025.
During the three months ended March 31, 2025, the fair value of our investment portfolio increased $172 million primarily due to a decline of 36 basis points in the 10-year U.S. Treasury rate. These gains were mostly offset by net losses on our hedging portfolio of $(171) million (excluding $11 million of net periodic interest we earned from our interest rate swaps), as a result of the decline in 10-year and 30-year U.S. Treasury rates, lower SOFR rates across the curve and swaps spreads becoming more negative.
The following tables provide details on realized and unrealized gains and losses within our investment and interest rate hedging portfolios for the periods indicated:
| Three Months Ended | ||||||||||||||||||||||||||
| June 30, 2025 | ||||||||||||||||||||||||||
| ($s in thousands) | Realized Gain (Loss) Recognized in Net Income | Unrealized Gain (Loss) Recognized in Net Income | Unrealized Gain (Loss) Recognized in OCI | Total Change in Fair Value | ||||||||||||||||||||||
| Investment portfolio: | ||||||||||||||||||||||||||
| Agency RMBS | $ | — | $ | 29,102 | $ | 3,629 | $ | 32,731 | ||||||||||||||||||
| Agency CMBS | — | 4,266 | 426 | 4,692 | ||||||||||||||||||||||
| CMBS IO | — | 315 | 9 | 324 | ||||||||||||||||||||||
| Mortgage loans | — | (31) | — | (31) | ||||||||||||||||||||||
| Subtotal | — | 33,652 | 4,064 | 37,716 | ||||||||||||||||||||||
TBA securities (1)
|
(21,014) | 28,622 | — | 7,608 | ||||||||||||||||||||||
Net gain on investments |
$ | (21,014) | $ | 62,274 | $ | 4,064 | $ | 45,324 | ||||||||||||||||||
| Interest rate hedging portfolio: | ||||||||||||||||||||||||||
| U.S. Treasury futures | $ | 58,270 | $ | (51,950) | $ | — | $ | 6,320 | ||||||||||||||||||
Interest rate swaps (2)
|
12,349 | (84,552) | — | (72,203) | ||||||||||||||||||||||
Interest rate swaptions |
— | 182 | — | 182 | ||||||||||||||||||||||
Net loss on interest rate hedges |
$ | 70,619 | $ | (136,320) | $ | — | $ | (65,701) | ||||||||||||||||||
Total net gain (loss) |
$ | 49,605 | $ | (74,046) | $ | 4,064 | $ | (20,377) | ||||||||||||||||||
| Three Months Ended | ||||||||||||||||||||||||||
| March 31, 2025 | ||||||||||||||||||||||||||
| ($s in thousands) | Realized Gain (Loss) Recognized in Net Income | Unrealized Gain (Loss) Recognized in Net Income | Unrealized Gain (Loss) Recognized in OCI | Total Change in Fair Value | ||||||||||||||||||||||
| Investment portfolio: | ||||||||||||||||||||||||||
| Agency RMBS | $ | — | $ | 109,260 | $ | 16,916 | $ | 126,176 | ||||||||||||||||||
| Agency CMBS | — | 110 | 1,126 | 1,236 | ||||||||||||||||||||||
| CMBS IO | — | 609 | 1,348 | 1,957 | ||||||||||||||||||||||
| Mortgage loans | — | 18 | — | 18 | ||||||||||||||||||||||
| Subtotal | — | 109,997 | 19,390 | 129,387 | ||||||||||||||||||||||
TBA securities (1)
|
17,323 | 24,851 | — | 42,174 | ||||||||||||||||||||||
Net gains on investments |
$ | 17,323 | $ | 134,848 | $ | 19,390 | $ | 171,561 | ||||||||||||||||||
| Interest rate hedging portfolio: | ||||||||||||||||||||||||||
| U.S. Treasury futures | $ | (25,801) | $ | (18,546) | $ | — | $ | (44,347) | ||||||||||||||||||
Interest rate swaps (2)
|
10,851 | (127,577) | — | (116,726) | ||||||||||||||||||||||
Interest rate swaptions |
— | 811 | — | 811 | ||||||||||||||||||||||
Net losses on interest rate hedges |
$ | (14,950) | $ | (145,312) | $ | — | $ | (160,262) | ||||||||||||||||||
Total net gain (loss) |
$ | 2,373 | $ | (10,464) | $ | 19,390 | $ | 11,299 | ||||||||||||||||||
1)Realized and unrealized gains (losses) on TBA securities are recorded within “gain (loss) on derivative instruments, net” on the Company’s consolidated statements of comprehensive income.
2)Realized gain (loss) for interest rate swaps consists of net periodic interest benefit of $12.3 million for the three months ended June 30, 2025 and $10.9 million for the three months ended March 31, 2025.
Operating Expenses
Operating expenses for the three months ended June 30, 2025, declined slightly compared to the three months ended March 31, 2025 due to lower legal and consulting expenses.
Six Months Ended June 30, 2025 Compared to the Six Months Ended June 30, 2024
Net Interest Income
Net interest income and net interest spread improved for the six months ended June 30, 2025, compared to the six months ended June 30, 2024 due to the purchases of higher yielding Agency RMBS over the past year. In addition, our financing costs during the six months ended June 30, 2025 declined approximately 99 basis points compared to the six months ended June 30, 2024, due primarily to the interest rate cuts implemented by the FOMC since June 30, 2024.
The following table presents information about our interest-earning assets and interest-bearing liabilities and their performance for the periods indicated:
| Six Months Ended | |||||||||||||||||||||||||||||||||||
| June 30, | |||||||||||||||||||||||||||||||||||
| 2025 | 2024 |
||||||||||||||||||||||||||||||||||
| ($s in thousands) | Interest Income/Expense |
Average Balance (1)(2)
|
Effective Yield/
Financing Cost (3)(4)
|
Interest Income/Expense |
Average Balance (1)(2)
|
Effective Yield/
Financing Cost (3)(4)
|
|||||||||||||||||||||||||||||
| Agency RMBS | $ | 192,813 | 8,197,426 | 4.70 | % | $ | 132,207 | $ | 6,045,897 | 4.37 | % | ||||||||||||||||||||||||
| Agency CMBS | 2,679 | 138,632 | 3.84 | % | 1,717 | 112,304 | 3.02 | % | |||||||||||||||||||||||||||
CMBS IO (5)
|
4,944 | 109,190 | 9.13 | % | 5,523 | 153,211 | 6.90 | % | |||||||||||||||||||||||||||
Mortgage loans |
26 | 969 | 4.66 | % | 42 | 1,605 | 4.86 | % | |||||||||||||||||||||||||||
| MBS and loans | $ | 200,462 | $ | 8,446,217 | 4.75 | % | $ | 139,489 | $ | 6,313,017 | 4.41 | % | |||||||||||||||||||||||
| Cash equivalents | 6,343 | 8,091 | |||||||||||||||||||||||||||||||||
| Total interest income | $ | 206,805 | $ | 147,580 | |||||||||||||||||||||||||||||||
| Repurchase agreement financing | (166,545) | 7,359,899 | (4.50) | % | (149,484) | 5,387,929 | (5.49) | % | |||||||||||||||||||||||||||
Net interest income (expense)/spread |
$ | 40,260 | 0.25 | % | $ | (1,904) | (1.08) | % | |||||||||||||||||||||||||||
Net periodic interest (6)
|
23,200 | 0.63 | % | 17 | — | % | |||||||||||||||||||||||||||||
Economic net interest income (expense)/spread (6)
|
$ | 63,460 | 0.88 | % | $ | (1,887) | (1.08) | % | |||||||||||||||||||||||||||
*Table Note: Data may not foot due to rounding. | |||||||||||||||||||||||||||||||||||
(1)Average balance for assets is calculated as a simple average of the daily amortized cost and excludes securities pending settlement if applicable.
(2)Average balance for liabilities is calculated as a simple average of the daily borrowings outstanding during the period.
(3)Effective yield is calculated by dividing interest income by the average balance of asset type outstanding during the reporting period. Unscheduled adjustments to premium/discount amortization/accretion, such as for prepayment compensation, are not annualized in this calculation.
(4)Financing cost is calculated by dividing annualized interest expense by the total average balance of borrowings outstanding during the period with an assumption of 360 days in a year.
(5)Includes Agency and non-Agency issued securities.
(6)Net periodic interest is the difference between the fixed interest rate we pay and the variable interest rate we receive on our interest rate swaps. It is a component of economic net interest income (expense), a non-GAAP measure. Please refer to the section below “Non-GAAP Financial Measures” for more information.
The following table presents information regarding the performance of our TBA dollar roll transactions for the periods indicated:
| Six Months Ended | ||||||||||||||||||||||||||||||||||||||
| June 30, | ||||||||||||||||||||||||||||||||||||||
| 2025 | 2024 | |||||||||||||||||||||||||||||||||||||
| ($s in thousands) |
Implied Net Interest Income (1)
|
Average Balance |
Implied Net Spread |
Implied Net Interest Expense (1)
|
Average Balance | Implied Net Spread | ||||||||||||||||||||||||||||||||
TBAs |
$ | 9,542 | $ | 2,413,041 | 0.79 | % | $ | (1,500) | $ | 1,786,687 | (0.17) | % | ||||||||||||||||||||||||||
(1)Implied net interest income (expense) is also referred to as “drop income (loss)” and represents a portion of the total realized gain (loss) from our TBA dollar roll transactions recorded within “gain (loss) on derivative instruments, net.”
Gains (Losses) on Investments and Derivative Instruments
During the six months ended June 30, 2025, losses on our hedging portfolio exceeded gains on our investments by approximately $32 million (excluding $23 million in net periodic interest we earned from interest rate swaps) due primarily to the decline in SOFR-based swap rates across the curve since December 31, 2024.
During the six months ended June 30, 2024, gains on our hedging portfolio exceeded losses on our investments by approximately $35 million. The impact of the 52 basis point increase in the 10-year U.S. Treasury rate on our investments was offset by the resulting gains on our hedging portfolio of approximately $204 million.
The following tables provide details on realized and unrealized gains and losses within our investment and interest rate hedging portfolios for the periods indicated:
| Six Months Ended | ||||||||||||||||||||||||||
| June 30, 2025 | ||||||||||||||||||||||||||
| ($s in thousands) | Realized Gain (Loss) Recognized in Net Income | Unrealized Gain (Loss) Recognized in Net Income | Unrealized Gain (Loss) Recognized in OCI | Total Change in Fair Value | ||||||||||||||||||||||
| Investment portfolio: | ||||||||||||||||||||||||||
| Agency RMBS | $ | — | $ | 138,362 | $ | 20,545 | $ | 158,907 | ||||||||||||||||||
| Agency CMBS | — | 4,376 | 1,552 | 5,928 | ||||||||||||||||||||||
| CMBS IO | — | 924 | 1,357 | 2,281 | ||||||||||||||||||||||
| Mortgage loans | — | (13) | — | (13) | ||||||||||||||||||||||
| Subtotal | — | 143,649 | 23,454 | 167,103 | ||||||||||||||||||||||
TBA securities (1)
|
(3,690) | 53,473 | — | 49,783 | ||||||||||||||||||||||
Net (loss) gain on investments |
$ | (3,690) | $ | 197,122 | $ | 23,454 | $ | 216,886 | ||||||||||||||||||
| Interest rate hedging portfolio: | ||||||||||||||||||||||||||
| U.S. Treasury futures | $ | 32,469 | $ | (70,496) | $ | — | $ | (38,027) | ||||||||||||||||||
Interest rate swaps (2)
|
23,200 | (212,130) | — | (188,930) | ||||||||||||||||||||||
Interest rate swaptions |
— | 993 | — | 993 | ||||||||||||||||||||||
Net gain (loss) on interest rate hedges |
$ | 55,669 | $ | (281,633) | $ | — | $ | (225,964) | ||||||||||||||||||
Total net gain (loss) |
$ | 51,979 | $ | (84,511) | $ | 23,454 | $ | (9,078) | ||||||||||||||||||
| Six Months Ended | ||||||||||||||||||||||||||
| June 30, 2024 | ||||||||||||||||||||||||||
| ($s in thousands) | Realized Gain (Loss) Recognized in Net Income | Unrealized Gain (Loss) Recognized in Net Income | Unrealized Gain (Loss) Recognized in OCI | Total Change in Fair Value | ||||||||||||||||||||||
| Investment portfolio: | ||||||||||||||||||||||||||
| Agency RMBS | $ | — | $ | (113,381) | $ | (19,881) | $ | (133,262) | ||||||||||||||||||
| Agency CMBS | — | 1,073 | 97 | 1,170 | ||||||||||||||||||||||
| CMBS IO | — | 157 | 683 | 840 | ||||||||||||||||||||||
| Mortgage loans | — | 150 | 47 | 197 | ||||||||||||||||||||||
| Subtotal | — | (112,001) | (19,054) | (131,055) | ||||||||||||||||||||||
TBA securities (1)
|
9,771 | (47,931) | — | (38,160) | ||||||||||||||||||||||
Net gain (loss) on investments |
$ | 9,771 | $ | (159,932) | $ | (19,054) | $ | (169,215) | ||||||||||||||||||
| Interest rate hedging portfolio: | ||||||||||||||||||||||||||
| U.S. Treasury futures | $ | 18,303 | $ | 185,718 | $ | — | $ | 204,021 | ||||||||||||||||||
Interest rate swaps |
17 | (107) | — | (90) | ||||||||||||||||||||||
Net gain on interest rate hedges |
$ | 18,320 | $ | 185,611 | $ | — | $ | 203,931 | ||||||||||||||||||
Total net gain (loss) |
$ | 28,091 | $ | 25,679 | $ | (19,054) | $ | 34,716 | ||||||||||||||||||
1)Realized and unrealized gains (losses) on TBA securities are recorded within “gain (loss) on derivative instruments, net” on the Company’s consolidated statements of comprehensive income.
2)Realized gain (loss) for interest rate swaps consists of net periodic interest benefit of $23.2 million for the six months ended June 30, 2025 and $17.0 thousand for the six months ended June 30, 2024.
Operating Expenses
Operating expenses for the six months ended June 30, 2025 increased $6 million compared to the six months ended June 30, 2024 due to higher salary, bonus, and share-based compensation expenses.
Non-GAAP Financial Measures
In evaluating the Company’s financial and operating performance, management considers book value per common share, total economic return (loss) to common shareholders, and other operating results presented in accordance with GAAP as well as certain non-GAAP financial measures, which include earnings available for distribution (“EAD”) to common shareholders (including per common share) and economic net interest income and the related metric economic net interest spread. Management believes these non-GAAP financial measures may be useful to investors because they are viewed by management as a measure of the investment portfolio’s return based on the effective yield of its investments, net of financing costs and, with respect to EAD, net of other normal recurring operating income/expenses.
Drop income generated by TBA dollar roll positions, which is included in "gain (loss) on derivatives instruments, net" on the Company's consolidated statements of comprehensive income, is included in EAD because management views drop income as the economic equivalent of net interest income (interest income less implied financing cost) on the underlying Agency security from trade date to settlement date. However, drop income/loss does not represent the total realized gain/loss from the Company’s investments in TBA securities.
Management also includes net periodic interest from its interest rate swaps, which is included in "gain (loss) on derivatives instruments, net," in EAD and economic net interest income because interest rate swaps are used by the Company to economically hedge the impact of changing interest rates on its borrowing costs from
repurchase agreements, and including net periodic interest from interest rate swaps is a helpful indicator of the Company’s total financing cost in addition to GAAP interest expense.
Non-GAAP financial measures are not a substitute for GAAP earnings and may not be comparable to similarly titled measures of other REITs because they may not be calculated in the same manner. Furthermore, though EAD is one of several factors our management considers in determining the appropriate level of distributions to common shareholders, it should not be utilized in isolation, and it is not an accurate indication of the Company’s REIT taxable income, its distribution requirements in accordance with the Tax Code or total economic return.
Reconciliations of each non-GAAP measure to certain GAAP financial measures are provided below.
Three Months Ended |
||||||||||||||
| Reconciliations of GAAP to Non-GAAP Financial Measures: | June 30, 2025 | March 31, 2025 | ||||||||||||
| ($s in thousands except per share data) | ||||||||||||||
| Comprehensive (loss) income to common shareholders (GAAP) | $ | (12,222) | $ | 14,391 | ||||||||||
| Less: | ||||||||||||||
Change in fair value of investments (1)
|
(37,716) | (129,387) | ||||||||||||
Change in fair value of derivative instruments, net (2)
|
75,200 | 133,724 | ||||||||||||
EAD to common shareholders (non-GAAP) |
$ | 25,262 | $ | 18,728 | ||||||||||
| Average common shares outstanding | 113,177,331 | 90,492,327 | ||||||||||||
EAD per common share (non-GAAP) |
$ | 0.22 | $ | 0.21 | ||||||||||
Net interest income (GAAP) |
$ | 23,128 | $ | 17,133 | ||||||||||
Net periodic interest income earned from interest rate swaps |
12,349 | 10,851 | ||||||||||||
Economic net interest income (non-GAAP) |
35,477 | 27,984 | ||||||||||||
TBA drop income (3)
|
4,758 | 4,785 | ||||||||||||
| Total operating expenses | (12,293) | (12,118) | ||||||||||||
| Preferred stock dividends | (2,680) | (1,923) | ||||||||||||
EAD to common shareholders (non-GAAP) |
$ | 25,262 | $ | 18,728 | ||||||||||
Net interest spread (GAAP) |
0.33 | % | 0.15 | % | ||||||||||
Net periodic interest from interest rate swaps as a percentage of average repurchase borrowings |
0.63 | % | 0.64 | % | ||||||||||
Economic net interest spread (non-GAAP) |
0.96 | % | 0.79 | % | ||||||||||
(1)Amount includes realized and unrealized gains and losses due to changes in the fair value of the Company’s MBS.
(2)The following table reconciles “change in fair value of derivative instruments, net” to the “gain (loss) on derivative instruments, net” shown on the consolidated statements of comprehensive income.
Three Months Ended |
||||||||||||||
| ($s in thousands) | June 30, 2025 | March 31, 2025 | ||||||||||||
Loss on derivative instruments, net |
$ | (58,093) | $ | (118,088) | ||||||||||
| Less: | ||||||||||||||
TBA drop income |
(4,758) | (4,785) | ||||||||||||
Net periodic interest income earned from interest rate swaps |
(12,349) | (10,851) | ||||||||||||
| Change in fair value of derivative instruments, net | $ | (75,200) | $ | (133,724) | ||||||||||
(3)TBA drop income is calculated by multiplying the notional amount of the TBA dollar roll positions by the difference in price between two TBA securities with the same terms but different settlement dates.
27
LIQUIDITY AND CAPITAL RESOURCES
Our primary sources of liquidity include borrowings under repurchase arrangements and monthly principal and interest payments we receive on our investments. Additional sources may include proceeds from the sale of investments, equity offerings, and net payments received from counterparties for derivative instruments. We use our liquidity to purchase investments, to pay amounts due on our repurchase agreement borrowings, and to pay our operating expenses and dividends on our common and preferred stock. We also use our liquidity to meet margin requirements for our repurchase agreements and derivative transactions, including TBA contracts, under the terms of the related agreements. We may also periodically use liquidity to repurchase shares of the Company’s stock.
During the six months ended June 30, 2025, we issued 40,712,768 shares of common stock through our ATM program, resulting in proceeds of $522 million, net of broker commissions and fees. We partially deployed these proceeds into Agency RMBS and to post initial margin requirements related to a larger hedge portfolio including interest rate swaps, swaptions, and U.S. Treasury futures.
Our liquidity fluctuates based on our investment activities, leverage, capital raising activities, and changes in the fair value of our investments and derivative instruments. Our measurement of liquidity includes unrestricted cash and cash equivalents and unencumbered Agency MBS, which are recognized as assets on our consolidated balance sheet. In our measure of liquidity, we also include the fair value of noncash collateral pledged to us by our counterparties, which we typically receive when the fair value of our pledged collateral exceeds our current margin requirement. Our liquidity as of June 30, 2025, was approximately $891 million, which consisted of unrestricted cash of $388 million, unencumbered Agency MBS with a fair value of $499 million, and noncash collateral pledged by our counterparties of $5 million. Our liquidity as of December 31, 2024, was $658 million.
We continuously monitor our liquidity, especially with potential risk events on the horizon, such as tariff changes, potential GSE transition, uncertainty regarding Federal Reserve policy decisions, the size of the Federal Reserve’s balance sheet, quantitative tightening or easing measures, the frequent potential for a government shutdown, and the impact on global markets stemming from global central bank policies. We are also monitoring the wars and conflicts around the globe. We continuously assess the adequacy of our liquidity under various scenarios based on changes in the fair value of our investments and derivative instruments due to market factors such as changes in the absolute level of interest rates and the shape of the yield curve, credit spreads, lender haircuts, and prepayment speeds, which in turn have an impact on margin requirements. In performing these analyses, we will also consider the current state of the fixed-income markets and the repurchase agreement markets to determine if market forces such as supply-demand imbalances or structural changes to these markets could change the liquidity of MBS or the availability of financing. We have not experienced any material changes in the terms of our repurchase agreements with our counterparties, and they have not indicated to us any concerns regarding access to liquidity.
Our perception of the liquidity of our investments and market conditions significantly influences our targeted leverage. In general, our leverage will increase if we view the risk-reward opportunity of higher leverage on our capital outweighs the risk to our liquidity and book value. Our leverage, which we calculate using total liabilities plus the cost basis of TBA long positions, was 8.3 times shareholders’ equity as of June 30, 2025. We include 100% of the cost basis of our TBA securities in evaluating our leverage because it is possible under certain market conditions that it may be uneconomical for us to roll a TBA long position into future months, which may result in us having to take physical delivery of the underlying securities and use cash or other financing sources to fund our total purchase commitment.
Repurchase Agreements
Leverage based solely on repurchase agreement amounts outstanding was 5.3 times shareholders’ equity as of June 30, 2025. Our repurchase agreement borrowings are uncommitted with terms renewable at the discretion of our lenders and generally have original terms to maturity of overnight to six months, though in some instances, we may enter into longer-dated maturities depending on market conditions. We seek to maintain unused capacity under our existing repurchase agreement credit lines with multiple counterparties, which helps protect us in the event of a counterparty's failure to renew existing repurchase agreements. As part of our continuous evaluation of counterparty risk, we maintain our highest counterparty exposures with broker-dealer subsidiaries of regulated financial institutions or primary dealers.
The amount outstanding for our repurchase agreement borrowings will typically fluctuate in any given period as it is dependent upon several factors, but particularly the extent to which we are active in buying and selling securities, including the volume of activity in TBA dollar roll transactions versus buying specified pools. The following table presents information regarding the balances of our repurchase agreement borrowings as of and for the periods indicated:
| Repurchase Agreements | |||||||||||||||||
| ($s in thousands) | Balance Outstanding As of Quarter End |
Average Balance Outstanding For the Quarter Ended | Maximum Balance Outstanding During the Quarter Ended | ||||||||||||||
| June 30, 2025 | $ | 8,600,143 | $ | 7,871,627 | $ | 8,600,487 | |||||||||||
| March 31, 2025 | 7,234,723 | 6,842,485 | 7,234,723 | ||||||||||||||
| December 31, 2024 | 6,563,120 | 6,431,743 | 6,568,805 | ||||||||||||||
| September 30, 2024 | 6,423,890 | 5,943,805 | 6,461,475 | ||||||||||||||
| June 30, 2024 | 5,494,428 | 5,410,282 | 5,529,856 | ||||||||||||||
| March 31, 2024 | 5,284,708 | 5,365,575 | 5,469,434 | ||||||||||||||
| December 31, 2023 | 5,381,104 | 5,168,821 | 5,381,354 | ||||||||||||||
| September 30, 2023 | 5,002,230 | 4,773,435 | 5,037,440 | ||||||||||||||
| June 30, 2023 | 4,201,901 | 3,447,406 | 4,203,788 | ||||||||||||||
For our repurchase agreement borrowings, we are required to post and maintain margin to the lender (i.e., collateral in excess of the repurchase agreement borrowing) in order to support the amount of the financing. This excess collateral is often referred to as a “haircut” and is intended to provide the lender protection against fluctuations in the fair value of the collateral and/or the failure by us to repay the borrowing at maturity. Lenders have the right to change haircut requirements at maturity of the repurchase agreement and may change their haircuts based on market conditions and the perceived riskiness of the collateral pledged. If the fair value of the collateral falls below the amount required by the lender, the lender has the right to demand additional margin or collateral. These demands are referred to as “margin calls,” and if we fail to meet any margin call, our lenders have the right to terminate the repurchase agreement and sell any collateral pledged. The weighted average haircut for our borrowings as of June 30, 2025, was consistent with prior periods, typically averaging less than 5% for borrowings collateralized with Agency RMBS and CMBS and between 10-14% for borrowings collateralized with CMBS IO.
The collateral we post in excess of our repurchase agreement borrowing with any counterparty is also typically referred to by us as “equity at risk,” which represents the potential loss to the Company if the counterparty is unable or unwilling to return collateral securing the repurchase agreement borrowing at its maturity. The counterparties with whom we have the greatest amounts of equity at risk may vary significantly during any given period due to the short-term and uncommitted nature of the repurchase agreement borrowings. As of June 30, 2025, we had amounts outstanding under 27 different repurchase agreements and did not have more than 10% of equity at risk with any counterparty or group of related counterparties.
We have various financial and operating covenants in certain of our repurchase agreements, which we monitor and evaluate on an ongoing basis for compliance as well as for impacts these customary covenants may have on our operating and financing flexibility. We do not believe we are subject to any covenants that materially restrict our financing flexibility. We were in full compliance with our debt covenants as of June 30, 2025, and we are not aware of circumstances that could potentially result in our non-compliance in the near future.
Derivative Instruments
Derivative instruments we enter into may require us to post initial margin at inception and daily variation margin based on subsequent changes in their fair value. Daily variation margin requirements also entitle us to receive collateral from our counterparties if the value of amounts owed to us under the derivative agreement exceeds
the minimum margin requirement. The collateral posted as margin by us is typically in cash. As of June 30, 2025, we had cash collateral posted to our counterparties of $318 million under these agreements.
Collateral requirements for interest rate derivative instruments are typically governed by the central clearing exchange and the associated futures commission merchant, which may establish margin requirements in excess of the clearing exchange. Collateral requirements for our TBA contracts are governed by the Mortgage-Backed Securities Division ("MBSD") of the Fixed Income Clearing Corporation and, if applicable, by our third-party brokerage agreements, which may establish margin levels in excess of the MBSD. Our TBA contracts, which are subject to master securities forward transaction agreements published by the Securities Industry and Financial Markets Association as well as supplemental terms and conditions with each counterparty, generally provide that valuations for our TBA contracts and any pledged collateral are to be obtained from a generally recognized source agreed to by both parties. However, in certain circumstances, our counterparties have the sole discretion to determine the value of the TBA contract and any pledged collateral. In such instances, our counterparties are required to act in good faith in making determinations of value. In the event of a margin call, we must generally provide additional collateral on the same business day.
The following table provides details on the “net receipts (payments) on derivative instruments” shown on our consolidated statements of cash flows for the periods indicated:
| Six Months Ended | ||||||||||||||
| June 30, | ||||||||||||||
Cash received or paid by instrument: |
2025 | 2024 | ||||||||||||
($s in thousands) |
||||||||||||||
Interest rate swaps: |
||||||||||||||
Net variation margin paid |
$ | (165,673) | $ | (111) | ||||||||||
Net periodic interest (1)
|
77 | — | ||||||||||||
| (165,596) | (111) | |||||||||||||
U.S. Treasury futures: |
||||||||||||||
Net variation margin (paid) received |
(45,364) | 166,641 | ||||||||||||
Received upon maturity/termination |
32,469 | 18,303 | ||||||||||||
| (12,895) | 184,944 | |||||||||||||
TBA securities: |
||||||||||||||
(Paid) received upon settlement |
(22,615) | 2,802 | ||||||||||||
Net (payments) receipts on derivative instruments |
$ | (201,106) | $ | 187,635 | ||||||||||
(1)Net periodic interest from our effective interest rate swaps is recognized as income or expense during the period earned or incurred, but the cash is not received or paid until the anniversary of each agreement’s effective date or upon maturity.
Dividends
We set our dividend based on many factors, including our view on long-term returns, yield on comparable investments, liquidity and market risk, and levels of taxable income. Among these factors, we focus on economic returns and taxable income within the context of the distribution requirements. As a REIT, we are required to distribute to our shareholders amounts equal to at least 90% of our REIT taxable income for each taxable year after certain deductions, including the separate dividend requirements of the Series C Preferred Stock.
We designate certain derivative instruments as interest rate hedges for tax purposes. Realized gains (losses) resulting from the difference in fair value and the amount of cash received or paid upon termination or maturity of designated derivative instruments are included in GAAP earnings in the same reporting period in which the derivative instrument matures or is terminated by the Company but are generally not recognized in REIT taxable income until future periods. Non-designated derivative instruments are included in GAAP earning and REIT taxable income in the same period the derivative instrument matures or is terminated by the Company. The table below
provides the projected amortization of the Company's net deferred tax hedge gains that may be recognized as taxable income over the periods indicated, given conditions known as of June 30, 2025; however, uncertainty inherent in the forward interest rate curve makes future realized gains and losses difficult to estimate, and as such, these projections are subject to change for any given period.
Projected Period of Recognition for Tax Hedge Gains, Net |
June 30, 2025 | |||||||
| ($ in thousands) | ||||||||
Fiscal year 2025 |
$ | 100,144 | ||||||
Fiscal year 2026 |
100,421 | |||||||
Fiscal year 2027 |
95,831 | |||||||
Fiscal year 2028 and thereafter |
422,642 | |||||||
| $ | 719,038 | |||||||
As of June 30, 2025, we also had $529 million in capital loss carryforwards, the majority of which will expire by December 31, 2028. Due to these amounts and other temporary and permanent differences between GAAP net income and REIT taxable income, coupled with the degree of uncertainty about the trajectory of interest rates, we cannot reasonably estimate how much the deferred tax hedge gains to be recognized will impact our dividend declarations during 2025 or in any given year.
We generally fund dividend distributions through portfolio cash flows. If we make dividend distributions in excess of our portfolio cash flows during the period, whether for purposes of meeting our REIT distribution requirements or other reasons, those distributions are generally funded either through our existing cash balances or through the return of principal from our investments (either through repayment or sale). Please refer to "Operating and Regulatory Structure" within Part I, Item 1, "Business," as well as Part I, Item 1A, “Risk Factors” of this Form 10-K for additional important information regarding dividends declared on our taxable income.
RECENT ACCOUNTING PRONOUNCEMENTS
Please refer to Note 1 of the Notes to the Consolidated Financial Statements contained within Part II, Item 8 of this Quarterly Report on Form 10-Q for additional information.
CRITICAL ACCOUNTING ESTIMATES
The discussion and analysis of our financial condition and results of operations are based in large part upon our consolidated financial statements, which have been prepared in accordance with GAAP. The preparation of our consolidated financial statements requires management to make estimates, judgments and assumptions that affect the reported amounts of assets, liabilities, revenues and expenses and disclosure of contingent assets and liabilities. We base these estimates and judgments on historical experience and assumptions believed to be reasonable under current facts and circumstances. Actual results may differ from the estimated amounts we have recorded.
Critical accounting estimates are defined as those that require management's most difficult, subjective, or complex judgments, and which may result in materially different results under different assumptions and conditions. Our critical accounting estimates are discussed in Part II, Item 7, “Management’s Discussion and Analysis of Financial Condition and Results of Operations” of our 2024 Form 10-K under “Critical Accounting Estimates.” There have been no significant changes in our critical accounting estimates during the three months ended June 30, 2025
FORWARD-LOOKING STATEMENTS
Certain written statements in this Quarterly Report on Form 10-Q that are not historical facts constitute “forward-looking statements” within the meaning of Section 27A of the Securities Act of 1933, as amended, and Section 21E of the Securities Exchange Act of 1934, as amended (the “Exchange Act”). Statements in this report addressing expectations, assumptions, beliefs, projections, future plans and strategies, future events, developments that we expect or anticipate will occur in the future, and future operating results, capital management, and dividend
28
policy are forward-looking statements. Forward-looking statements are based upon management’s beliefs, assumptions, and expectations as of the date of this report regarding future events and operating performance, considering all information currently available to us, and are applicable only as of the date of this report. Forward-looking statements generally can be identified by the use of words such as “believe,” “expect,” “anticipate,” “estimate,” “plan,” “may,” “will,” “intend,” “should,” “could,” or similar expressions. We caution readers not to place undue reliance on our forward-looking statements, which are not historical facts and may be based on projections, assumptions, expectations, and anticipated events that do not materialize. Except as required by law, we are not obligated to, and do not intend to, update or revise any forward-looking statement, whether as a result of new information, future events, or otherwise.
Forward-looking statements in this Quarterly Report on Form 10-Q may include, but are not limited to, statements about:
•Our business and investment strategy, including our ability to generate acceptable risk-adjusted returns, our target investment allocations, and our views on the future performance of MBS and other investments;
•Our views on the macroeconomic environment, monetary and fiscal policy, and conditions in the investment, credit, interest rate, and derivatives markets;
•Our views on inflation, market interest rates, and market spreads;
•Our views on the effect of actual or proposed actions of the Federal Reserve or other central banks with respect to monetary policy (including the targeted Fed Funds rate), and the potential impact of these actions on interest rates, borrowing costs, inflation, or unemployment;
•The effect of regulatory initiatives of the Federal Reserve, the Federal Housing Finance Agency, other financial regulators, and other central banks;
•Our financing strategy, including our target leverage ratios, our use of TBA dollar roll transactions, and anticipated trends in financing costs, including TBA dollar roll transaction costs, and our hedging strategy, including changes to the derivative instruments to which we are a party, and changes to government regulation of hedging instruments and our use of these instruments;
•Our investment portfolio composition and target investments;
•Our investment portfolio performance, including the fair value, yields, and forecasted prepayment speeds of our investments;
•Our liquidity and ability to access financing and the anticipated availability and cost of financing;
•Our capital stock activity, including the impact of stock issuances and repurchases;
•The amount, timing, and funding of future dividends;
•Our use of our tax NOL carryforward and other tax loss carryforwards;
•Future competition for, and availability of, investments, financing, and capital;
•Estimates of future interest expenses, including related to the Company’s repurchase agreements and derivative instruments;
•The status and effect of legislative reforms and regulatory rule-making or review processes, and the status of reform efforts and other business developments in the repurchase agreement financing market;
•Market, industry, and economic trends, and how these trends and related economic data may impact the behavior of market participants and financial regulators;
•The impact of bank failures, potential new regulations, and the potential for other bank failures;
•The impact of debt ceiling negotiations on interest rates, spreads, the U.S. Treasury market and the impact more broadly on fixed income and equity markets;
•Uncertainties regarding the war between Russia and Ukraine or the conflict in the Middle East, and the related impacts on macroeconomic conditions, including, among other things, interest rates;
•The financial position and creditworthiness of the depository institutions in which the Company’s MBS and cash deposits are held;
•The impact of applicable tax and accounting requirements on us, including our tax treatment of derivative instruments such as TBAs, interest rate swaps, options, and futures;
•Our future compliance with covenants in our master repurchase agreements, ISDA agreements, and debt covenants in our other contractual agreements;
•Our reliance on a single service provider for our trading, portfolio management, and risk reporting systems;
29
•The implementation in a timely and cost-effective manner of our operating platform, which includes trading, portfolio management, risk reporting, and accounting services systems, and the anticipated benefits thereof; and
•Possible future effects of any global health crisis.
Forward-looking statements are inherently subject to risks, uncertainties and other factors that could cause our actual results to differ materially from historical results or from any results expressed or implied by such forward-looking statements. Not all these risks and other factors are known to us. New risks and uncertainties arise over time, and it is not possible to predict those events or how they may affect us. The projections, assumptions, expectations, or beliefs upon which the forward-looking statements are based can also change as a result of these risks or other factors. If such a risk or other factor materializes in future periods, our business, financial condition, liquidity, and results of operations may vary materially from those expressed or implied in our forward-looking statements.
While it is not possible to identify all factors that may cause actual results to differ from historical results or any results expressed or implied by forward-looking statements or that may cause our projections, assumptions, expectations, or beliefs to change, some of those factors include the following:
•the risks and uncertainties referenced in this Quarterly Report on Form 10-Q, especially those incorporated by reference into Part I, Item 1A, “Risk Factors,”
•our ability to find suitable reinvestment opportunities;
•changes in domestic economic conditions;
•geopolitical events, such as terrorism, war, or other military conflict, including the war between Russia and Ukraine and the conflict in the Middle East, and the related impact on macroeconomic conditions as a result of such conflict;
•tariffs that the U.S. imposes on trading partners or tariffs imposed on the U.S. from trading partners;
•global government policy changes and the ability or inability to react to rapidly changing global economic policies;
•changes in interest rates and credit spreads, including the repricing of interest-earning assets and interest-bearing liabilities;
•our investment portfolio performance, particularly as it relates to cash flow, prepayment rates, and credit performance;
•the impact on markets and asset prices from changes in the Federal Reserve’s policies regarding the purchases of Agency RMBS, Agency CMBS, and U.S. Treasuries;
•actual or anticipated changes in Federal Reserve monetary policy or the monetary policy of other central banks;
•adverse reactions in U.S. financial markets related to actions of foreign central banks or the economic performance of foreign economies, including in particular China, Japan, the European Union, and the United Kingdom;
•uncertainty concerning the long-term fiscal health and stability of the United States;
•the cost and availability of financing, including the future availability of financing due to changes to regulation of, and capital requirements imposed upon, financial institutions;
•the cost and availability of new equity capital;
•changes in our leverage and use of leverage;
•changes to our investment strategy, operating policies, dividend policy, or asset allocations;
•the quality of performance of third-party service providers, including our sole third-party service provider for our critical operations and trade functions;
•the loss or unavailability of our third-party service provider’s service and technology that supports critical functions of our business related to our trading and borrowing activities due to outages, interruptions, or other failures;
•the level of defaults by borrowers on loans underlying MBS;
•changes in our industry;
•increased competition;
•changes in government regulations affecting our business;
•changes or volatility in the repurchase agreement financing markets and other credit markets;
30
•changes to the market for interest rate swaps and other derivative instruments, including changes to margin requirements on derivative instruments;
•uncertainty regarding continued government support of the U.S. financial system and U.S. housing and real estate markets, or to reform the U.S. housing finance system, including the resolution of the conservatorship of Fannie Mae and Freddie Mac;
•the composition of the Board of Governors of the Federal Reserve;
•the political environment in the U.S.;
•systems failures or cybersecurity incidents; and
•exposure to current and future claims and litigation.
Regulation FD Disclosures
We routinely announce material information to investors and the marketplace using filings with the SEC, press releases, public conference calls, presentations, webcasts, and the investor relations page of our website at www.dynexcapital.com/investors and our LinkedIn Page at www.linkedin.com/company/dynex-capital-inc. We use these channels for purposes of compliance with Regulation FD and as routine channels for distribution of important information. While not all of the information that we post to the investor relations page of our website or to our LinkedIn Page is of a material nature, some information could be deemed to be material. Accordingly, investors should monitor these channels, in addition to following our press releases, SEC filings, and public conference calls and webcasts. The web addresses are included in this Quarterly Report on Form 10-Q as textual references only and the information posted on these channels are not incorporated by reference in this Quarterly Report on Form 10-Q or in any other report or document we file with the SEC.
ITEM 3. QUANTITATIVE AND QUALITATIVE DISCLOSURES ABOUT MARKET RISK
Market risk is the exposure to losses resulting from changes in market factors. Our business strategy exposes us to a variety of market risks, including interest rate, spread, prepayment, credit, liquidity, and reinvestment risks. These risks can and do cause fluctuations in our liquidity, comprehensive income and book value as discussed below.
Interest Rate Risk
Investing in interest-rate sensitive investments such as MBS and TBA securities subjects us to interest rate risk. Interest rate risk results from investing in securities with a fixed coupon or a floating coupon that may not immediately adjust for changes in interest rates. Interest rate risk also results from the mismatch between the duration of our assets versus the duration of our liabilities and hedges. The amount of the impact will depend on the composition of our portfolio, our hedging strategy, the effectiveness of our hedging instruments and the magnitude and duration of the change in interest rates.
We manage interest rate risk within tolerances set by our Board of Directors. We use interest rate hedging instruments to mitigate the impact of changing interest rates on the market value of our assets and on our interest expense from repurchase agreements used to finance our investments. Our hedging methods are based on many factors, including, but not limited to, our estimates regarding future interest rates and expected levels of prepayments of our assets. If prepayments are slower or faster than assumed, the maturity of our investments will also differ from our expectations, which could reduce the effectiveness of our hedging strategies and may cause losses that adversely affect our cash flow. Estimates of prepayment speeds can vary significantly by investor for the same security, and therefore, estimates of security and portfolio duration can vary considerably between market participants.
We continuously monitor market conditions, economic conditions, interest rates, and other market activity and adjust the composition of our investments and hedges throughout any given period. As such, the projections for changes in market value provided below are limited in usefulness because the modeling assumes no changes to the composition of our investment portfolio or hedging instruments as of the dates indicated. Changes in the types of our investments, the returns earned on these investments, future interest rates, credit spreads, the shape of the yield curve, the availability of financing, and/or the mix of our investments and financings, including derivative instruments, may cause actual results to differ significantly from the modeled results shown in the tables below.
31
Therefore, the modeled results shown in the tables below and all related disclosures constitute forward-looking statements.
Management evaluates changes in interest rate curves to manage portfolio interest rate risk and the market value of its investments and common equity. Because interest rates do not typically move in a parallel fashion from period to period (as can be seen by the graph for U.S. Treasury rates in Item 2, “Executive Overview”), the tables below show the projected sensitivity of our financial instruments and equity to both parallel and non-parallel shifts in market interest rates.
| June 30, 2025 | ||||||||||||||||||||||||||||||||||||||||||||||||||
| Parallel Decrease in Interest Rates of | Parallel Increase in Interest Rates of | |||||||||||||||||||||||||||||||||||||||||||||||||
| 100 Basis Points | 50 Basis Points | 50 Basis Points | 100 Basis Points | |||||||||||||||||||||||||||||||||||||||||||||||
|
Type of
Instrument (1)
|
% of Market Value | % of Common Equity | % of Market Value | % of Common Equity | % of Market Value | % of Common Equity | % of Market Value | % of Common Equity | ||||||||||||||||||||||||||||||||||||||||||
| RMBS | 3.0 | % | 28.0 | % | 1.6 | % | 15.6 | % | (1.9) | % | (17.6) | % | (3.9) | % | (37.0) | % | ||||||||||||||||||||||||||||||||||
|
CMBS/
CMBS IO
|
0.2 | % | 1.5 | % | 0.1 | % | 0.7 | % | (0.1) | % | (0.7) | % | (0.1) | % | (1.4) | % | ||||||||||||||||||||||||||||||||||
| TBAs | 1.1 | % | 10.7 | % | 0.6 | % | 6.0 | % | (0.7) | % | (6.8) | % | (1.5) | % | (14.4) | % | ||||||||||||||||||||||||||||||||||
| Interest rate hedges | (5.1) | % | (48.2) | % | (2.5) | % | (23.7) | % | 2.4 | % | 22.6 | % | 4.8 | % | 45.0 | % | ||||||||||||||||||||||||||||||||||
| Total | (0.8) | % | (8.0) | % | (0.1) | % | (1.3) | % | (0.3) | % | (2.5) | % | (0.8) | % | (7.8) | % | ||||||||||||||||||||||||||||||||||
| December 31, 2024 | ||||||||||||||||||||||||||||||||||||||||||||||||||
| Parallel Decrease in Interest Rates of | Parallel Increase in Interest Rates of | |||||||||||||||||||||||||||||||||||||||||||||||||
| 100 Basis Points | 50 Basis Points | 50 Basis Points | 100 Basis Points | |||||||||||||||||||||||||||||||||||||||||||||||
|
Type of
Instrument (1)
|
% of Market Value | % of Common Equity | % of Market Value | % of Common Equity | % of Market Value | % of Common Equity | % of Market Value | % of Common Equity | ||||||||||||||||||||||||||||||||||||||||||
| RMBS | 3.6 | % | 33.0 | % | 1.9 | % | 17.4 | % | (2.0) | % | (18.3) | % | (4.1) | % | (37.1) | % | ||||||||||||||||||||||||||||||||||
|
CMBS/
CMBS IO
|
0.1 | % | 0.8 | % | — | % | 0.3 | % | — | % | (0.3) | % | (0.1) | % | (0.8) | % | ||||||||||||||||||||||||||||||||||
| TBAs | 1.0 | % | 9.6 | % | 0.6 | % | 5.3 | % | (0.7) | % | (6.0) | % | (1.3) | % | (12.2) | % | ||||||||||||||||||||||||||||||||||
| Interest rate hedges | (5.0) | % | (46.2) | % | (2.5) | % | (22.6) | % | 2.3 | % | 21.2 | % | 4.6 | % | 41.9 | % | ||||||||||||||||||||||||||||||||||
| Total | (0.3) | % | (2.8) | % | — | % | 0.4 | % | (0.4) | % | (3.4) | % | (0.9) | % | (8.2) | % | ||||||||||||||||||||||||||||||||||
32
| June 30, 2025 | December 31, 2024 | |||||||||||||||||||||||||||||||||||||
Non-Parallel Shifts |
Basis Point Change in 2-year UST |
Basis Point Change in 10-year UST |
% of Market Value (1)
|
% of Common Equity |
% of Market Value (1)
|
% of Common Equity |
||||||||||||||||||||||||||||||||
| Bearish | Steepening |
+25 | +50 | (0.2) | % | (1.8) | % | (0.3) | % | (2.5) | % | |||||||||||||||||||||||||||
| +50 | +100 | (0.7) | % | (6.4) | % | (0.7) | % | (6.6) | % | |||||||||||||||||||||||||||||
Flattening |
+50 | +25 | (0.2) | % | (1.9) | % | (0.3) | % | (2.5) | % | ||||||||||||||||||||||||||||
+100 |
+50 |
(0.4) | % | (3.9) | % | (0.5) | % | (4.9) | % | |||||||||||||||||||||||||||||
| Bullish | Steepening |
-25 |
+0 |
0.1 | % | 1.0 | % | 0.1 | % | 1.4 | % | |||||||||||||||||||||||||||
| -50 | -10 | 0.2 | % | 1.8 | % | 0.3 | % | 2.6 | % | |||||||||||||||||||||||||||||
| -75 | -25 | 0.2 | % | 2.0 | % | 0.4 | % | 3.6 | % | |||||||||||||||||||||||||||||
Flattening |
+0 |
-25 | (0.1) | % | (0.9) | % | — | % | (0.4) | % | ||||||||||||||||||||||||||||
| -10 | -50 | (0.3) | % | (2.4) | % | (0.1) | % | (1.1) | % | |||||||||||||||||||||||||||||
| -25 | -75 | (0.6) | % | (5.5) | % | (0.3) | % | (3.0) | % | |||||||||||||||||||||||||||||
(1)Includes changes in market value of our investments and derivative instruments, including TBA securities, but excludes changes in market value of our financings which are not carried at fair value on our balance sheet due to their short-term maturities. The projections for market value do not assume any change in credit spreads.
Spread Risk
Spread risk is the risk of loss from an increase in the market spread between the yield on an investment versus its benchmark index. Changes in market spreads represent the market's valuation of the perceived riskiness of an asset relative to risk-free rates. Widening spreads reduce the market value of our investments as market participants require additional yield to hold riskier assets. Market spreads could change based on macroeconomic or systemic factors as well as the factors specific to a particular security, such as prepayment performance or credit performance. Other factors that could impact credit spreads include technical issues, such as supply and demand for a particular type of security or Federal Reserve monetary policy. We do not hedge spread risk given the cost and complexity of hedging credit spreads and, in our opinion, the lack of liquid instruments available to use as hedges.
Fluctuations in spreads typically vary based on the type of investment. Sensitivity to changes in market spreads is derived from models that are dependent on various assumptions, and actual changes in market value in response to changes in market spreads could differ materially from the projected sensitivity if actual conditions differ from these assumptions.
The table below shows the projected sensitivity of the market value of our investments given the indicated change in market spreads as of the dates indicated:
| June 30, 2025 | December 31, 2024 | |||||||||||||||||||||||||
| Percentage Change in | Percentage Change in | |||||||||||||||||||||||||
| Basis Point Change in Market Spreads |
Market Value of Investments (1)
|
% of Common Equity |
Market Value of Investments (1)
|
% of Common Equity |
||||||||||||||||||||||
+20/+50 (2)
|
(1.1) | % | (10.2) | % | (1.1) | % | (10.4) | % | ||||||||||||||||||
| +10 | (0.5) | % | (5.1) | % | (0.6) | % | (5.2) | % | ||||||||||||||||||
| -10 | 0.5 | % | 5.1 | % | 0.6 | % | 5.2 | % | ||||||||||||||||||
-20/-50 (2)
|
1.1 | % | 10.2 | % | 1.1 | % | 10.4 | % | ||||||||||||||||||
(1) Includes changes in market value of our MBS investments, including TBA securities.
(2) Assumes a 20-basis point shift in Agency and non-Agency RMBS and CMBS and a 50-basis point shift in Agency
and non-Agency CMBS IO.
33
Other Market Risks
In addition to the risks discussed above, we are also subject to prepayment risk, credit risk, liquidity risk, and reinvestment risk. We have not experienced any material changes in these risks during the first quarter of 2025. Please refer to Part I, Item 1A, “Risk Factors,” and Part II, Item 7A, “Quantitative and Qualitative Disclosures About Market Risks,” in our 2024 Form 10-K for further discussion.
ITEM 4. CONTROLS AND PROCEDURES
Disclosure Controls and Procedures
Our management evaluated, with the participation of our co-principal executive officers and principal financial officer, the effectiveness of our disclosure controls and procedures, as defined in Exchange Act Rule 13a-15(e), as of the end of the period covered by this report. Based on that evaluation, our co-principal executive officers and principal financial officer concluded that, as of June 30, 2025, our disclosure controls and procedures were effective to ensure that information required to be disclosed in the reports that we file or submit under the Exchange Act is recorded, processed, summarized and reported, within the time periods specified in the SEC’s rules and forms, and that such information is accumulated and communicated to our management, including our co-principal executive officers and principal financial officer, as appropriate, to allow timely decisions regarding required disclosure.
Changes in Internal Control over Financial Reporting
There were no changes in our internal control over financial reporting during the three months ended June 30, 2025 that materially affected, or are reasonably likely to materially affect, our internal control over financial reporting.
PART II. OTHER INFORMATION
ITEM 1. LEGAL PROCEEDINGS
To the Company’s knowledge, there are no pending or threatened legal proceedings, which, in management’s opinion, individually or in total, could have a material adverse effect on the Company’s results of operations or financial condition.
ITEM 1A. RISK FACTORS
There have been no material changes from the risk factors discussed in Part I, Item 1A, “Risk Factors” of our 2024 Form 10-K. Risks and uncertainties identified in our forward-looking statements contained in this Quarterly Report on Form 10-Q together with those previously disclosed in the 2024 Form 10-K or those that are presently unforeseen could result in significant adverse effects on our financial condition, results of operations and cash flows. See “Forward-Looking Statements” contained in Part I, Item 2, “Management’s Discussion and Analysis of Financial Condition and Results of Operations” in this Quarterly Report on Form 10-Q as well as Part I, Item 1A, “Risk Factors” in our 2024 Form 10-K.
34
ITEM 2. UNREGISTERED SALE OF EQUITY SECURITIES AND USE OF PROCEEDS
Issuer Purchases of Equity Securities
The Company’s Board of Directors has authorized a share repurchase program (the “Program”) of up to $100 million of the Company’s outstanding shares of common stock and up to $50 million of the Company’s Series C Preferred Stock through open market transactions, privately negotiated transactions, trading plans adopted in accordance with Rule 10b5-1 under the Exchange Act, block transactions or otherwise. The Program permits the Company to repurchase shares of common stock or Series C Preferred Stock at any time or from time-to-time at management’s discretion. The actual means and timing of any shares purchased under the Program will depend on a variety of factors, including, but not limited to, the market prices of the common stock and the Series C Preferred Stock, as applicable, general market and economic conditions, and applicable legal and regulatory requirements. The Program does not obligate the Company to purchase any shares, and any open market repurchases under the Program will be made in accordance with Exchange Act Rule 10b-18, which sets certain restrictions on the method, timing, price, and volume of open market stock repurchases. The Program is authorized through April 30, 2026, although it may be modified or terminated by the Board of Directors at any time.
The Company did not repurchase any shares of its common stock or Series C Preferred Stock during the three months ended June 30, 2025. Employees forfeited 59,146 common shares to cover payroll tax withholding on share-based compensation that vested during the six months ended June 30, 2025.
ITEM 3. DEFAULTS UPON SENIOR SECURITIES
None.
ITEM 4. MINE SAFETY DISCLOSURES
None.
ITEM 5. OTHER INFORMATION
Rule 10b5-1 Trading Plan
During the three months ended June 30, 2025, none of the Company’s directors or Section 16 officers adopted terminated
35
ITEM 6. EXHIBITS
| Exhibit No. | Description | ||||
| 3.1 | |||||
3.1.1 |
|||||
| 3.2 | |||||
| 4.1 | |||||
| 4.2 | |||||
| 4.3 | |||||
10.18* |
|||||
10.41.6* |
|||||
10.41.7* |
|||||
10.41.8* |
|||||
10.41.9* |
|||||
| 31.1 | |||||
31.2 |
|||||
31.3 |
|||||
| 32.1 | |||||
| 101 | The following materials from Dynex Capital, Inc.'s Quarterly Report on Form 10-Q for the three months ended June 30, 2025, formatted in iXBRL (Inline Extensible Business Reporting Language), filed herewith: (i) Consolidated Balance Sheets, (ii) Consolidated Statements of Comprehensive Income, (iii) Consolidated Statements of Shareholders’ Equity, (iv) Consolidated Statements of Cash Flows, and (v) Notes to the Consolidated Financial Statements. |
||||
| 104 | The cover page from Dynex Capital, Inc.'s Quarterly Report on Form 10-Q for the three months ended June 30, 2025, formatted in iXBRL (Inline Extensible Business Reporting Language) (included with Exhibit 101). |
||||
* Denotes a management contract or compensatory plan or arrangement.
36
SIGNATURES
Pursuant to the requirements of Section 13 or 15(d) of the Securities Exchange Act of 1934, the registrant has duly caused this report to be signed on its behalf by the undersigned, thereunto duly authorized.
| DYNEX CAPITAL, INC. | |||||||||||
| Date: | July 28, 2025 | /s/ Byron L. Boston | |||||||||
| Byron L. Boston | |||||||||||
| Co-Chief Executive Officer and Chairman of the Board | |||||||||||
| (Co-Principal Executive Officer) | |||||||||||
Date: |
July 28, 2025 | /s/ Smriti L. Popenoe |
|||||||||
Smriti L. Popenoe |
|||||||||||
Co-Chief Executive Officer and President |
|||||||||||
| (Co-Principal Executive Officer) | |||||||||||
| Date: | July 28, 2025 | /s/ Robert S. Colligan | |||||||||
| Robert S. Colligan | |||||||||||
Chief Financial Officer and Chief Operating Officer |
|||||||||||
| (Principal Financial Officer) | |||||||||||
37